Don't.
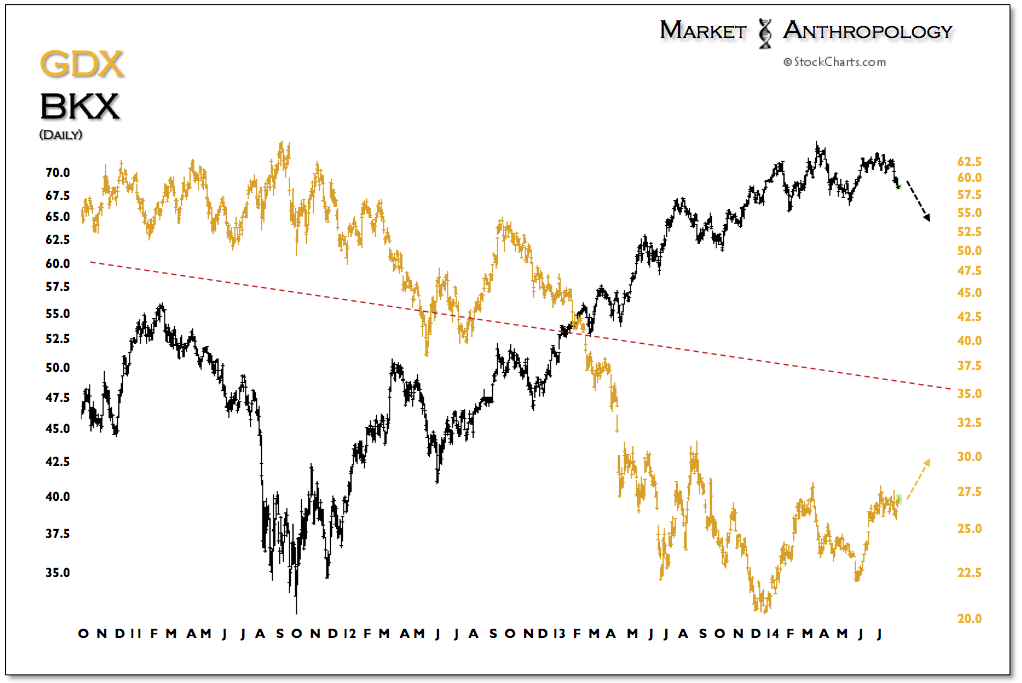
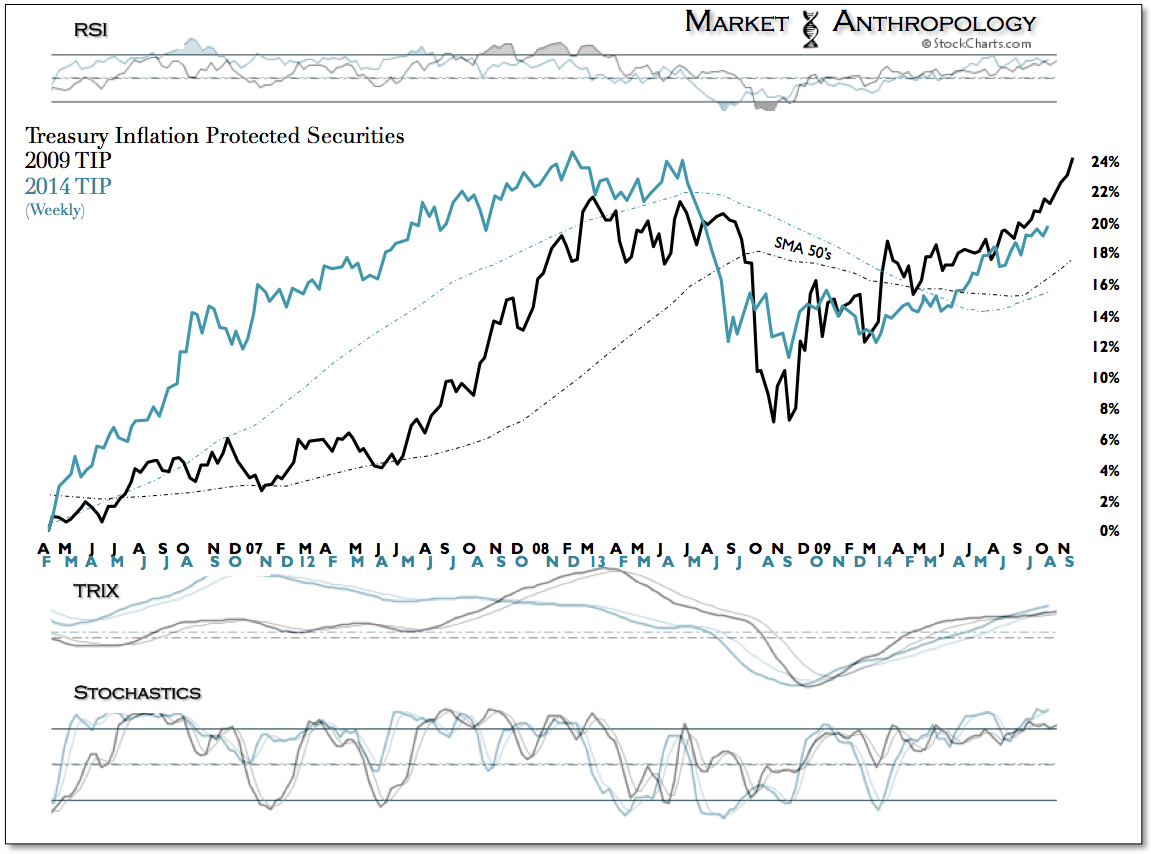
While these events have certainly not hurt demand, the respective trends in both Treasuries and gold have been in place all year and under what we believe are more endogenous and cyclical motivations - than event driven reflexes at the whim of Putin, Hamas or Israel. From our perspective, the same holds true with the recent cracks in the US equity markets, which we view as an obvious - but latent reaction, to the Fed slowly ending their policy support this fall.
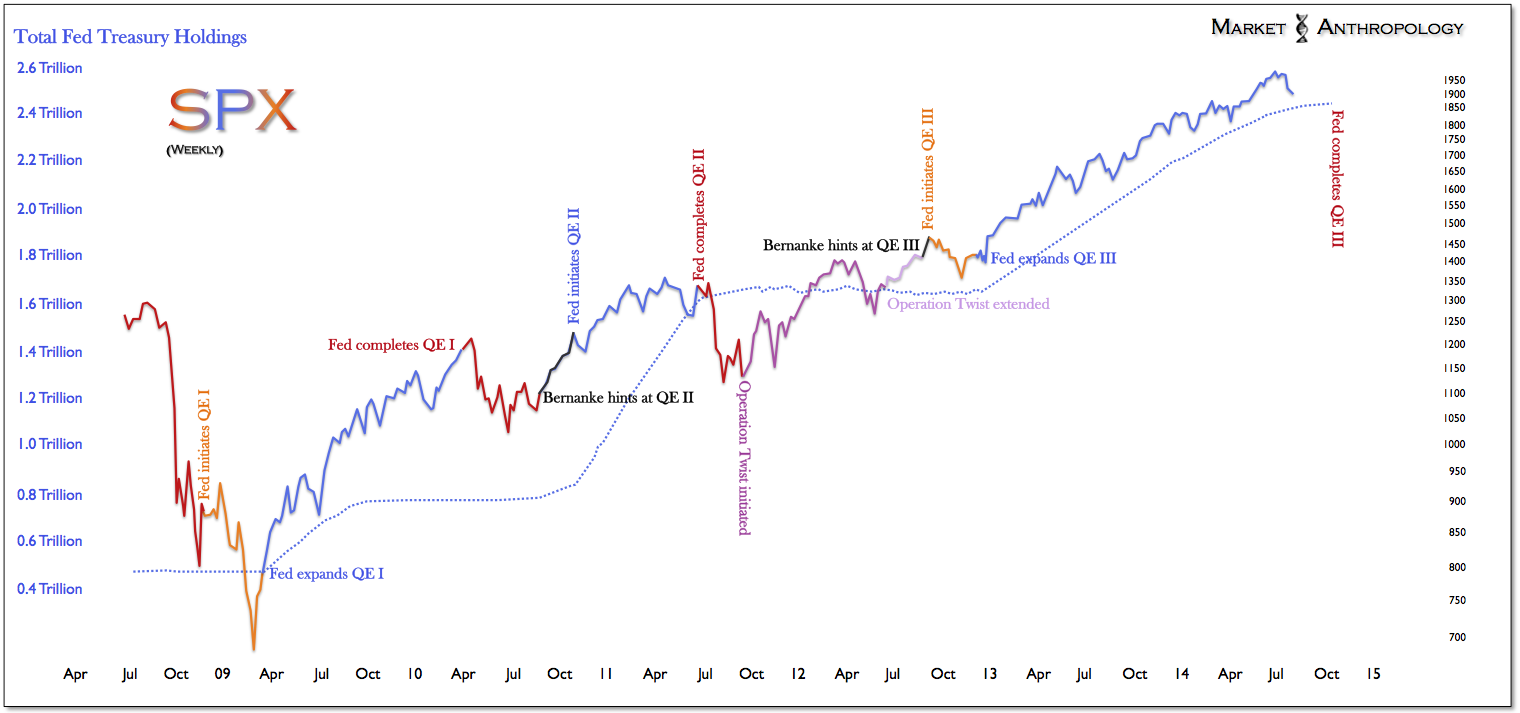 As we see things, the markets will continue to adjust to the visible hand of the Fed whom, to the shock and distrust of most, ran an open and heavily subsidized kitchen over the past five years and has been equally public and transparent about shutting it down. As obvious as that may be, ignoring the significance of their influence at these pivotal points in time, would be overlooking the performance in the US markets over the past five years and believing with 20/20 hindsight that the Fed's quite visible hand didn't play the commanding role.
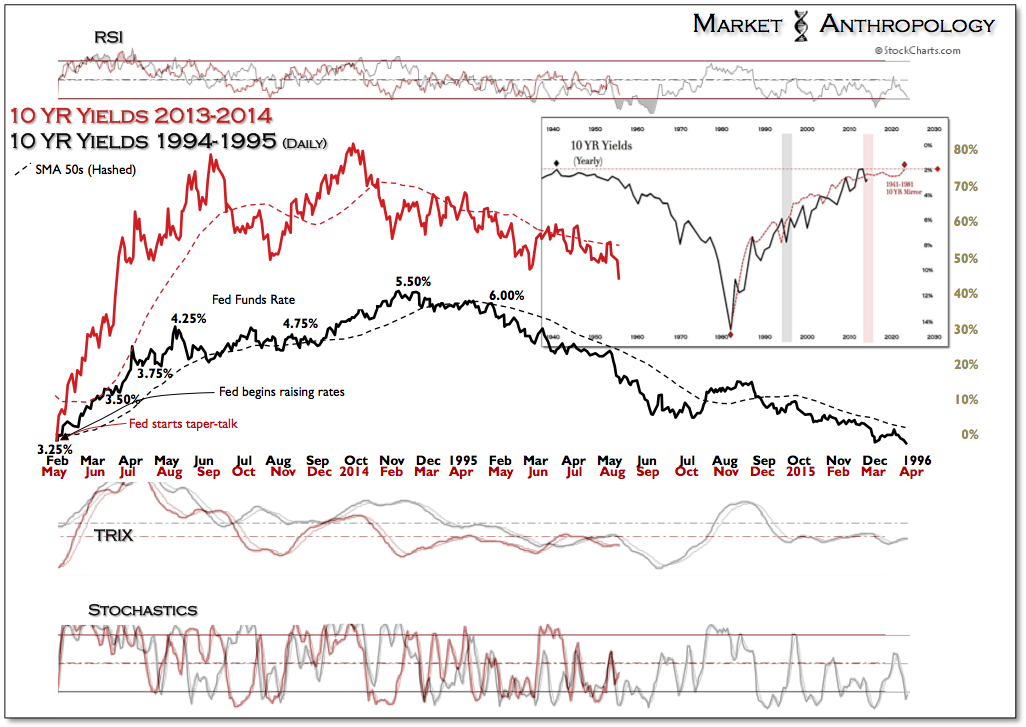
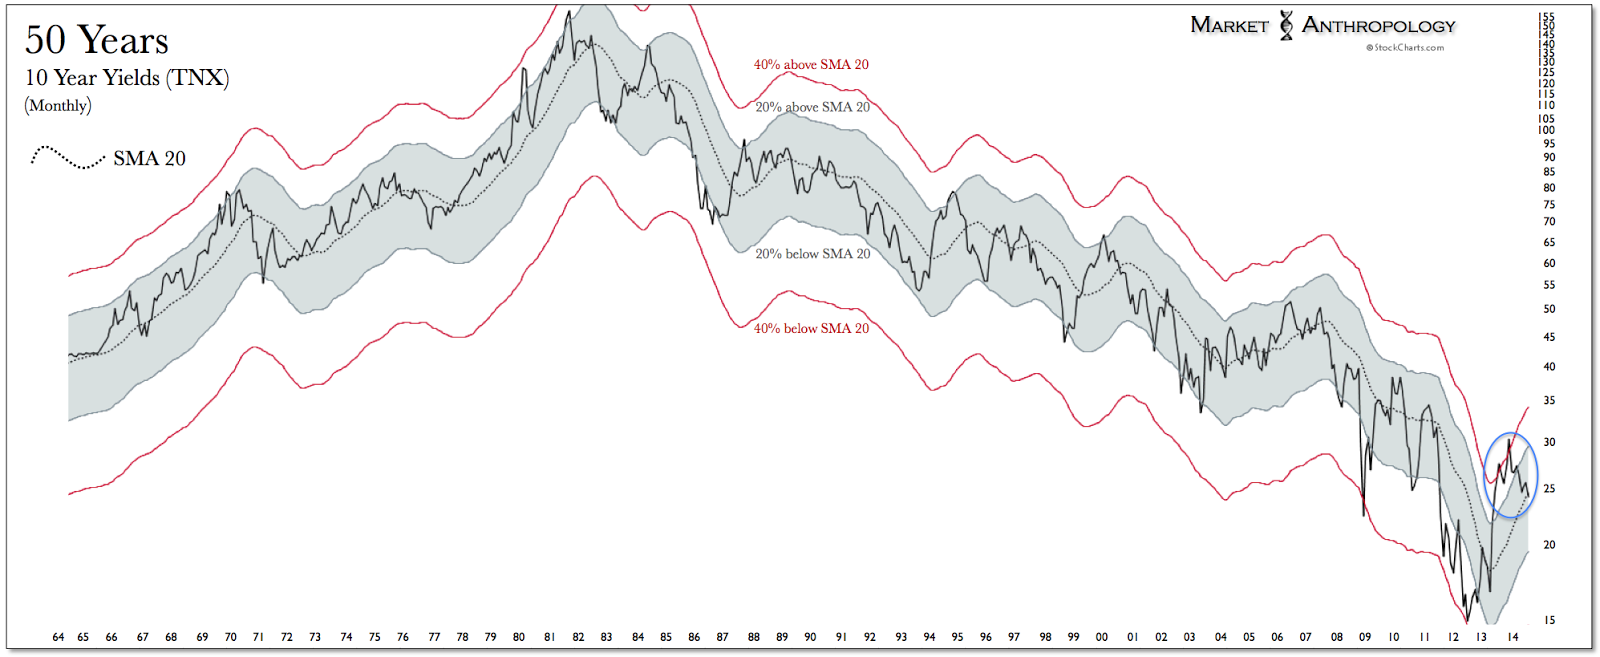
 Tangent to the market's adjustments to transparency on both sides of the field is the realization that the Fed has conducted policy over the past five years from the mystical plane beyond ZIRP. At its basest level, we have argued (see here) quantitative easing is about instilling expectations in the market, both from a structural and psychological perspective - beyond where conventional policy tools could apply. When the Fed began their fireside taper-talks last May, they tightened in effect through a pivot in expectations. On the Spinal Tap policy continuum that goes beyond the norm - they took the bold step and turned the volume down. Considering the move in U.S. 10-Year yields that followed, this was largely confirmed by the market - and why we have contrasted the trend in yields throughout this year with the arc of the unexpected rate tightening cycle in 1994 and 1995 that capsized the bond market and reset expectations.
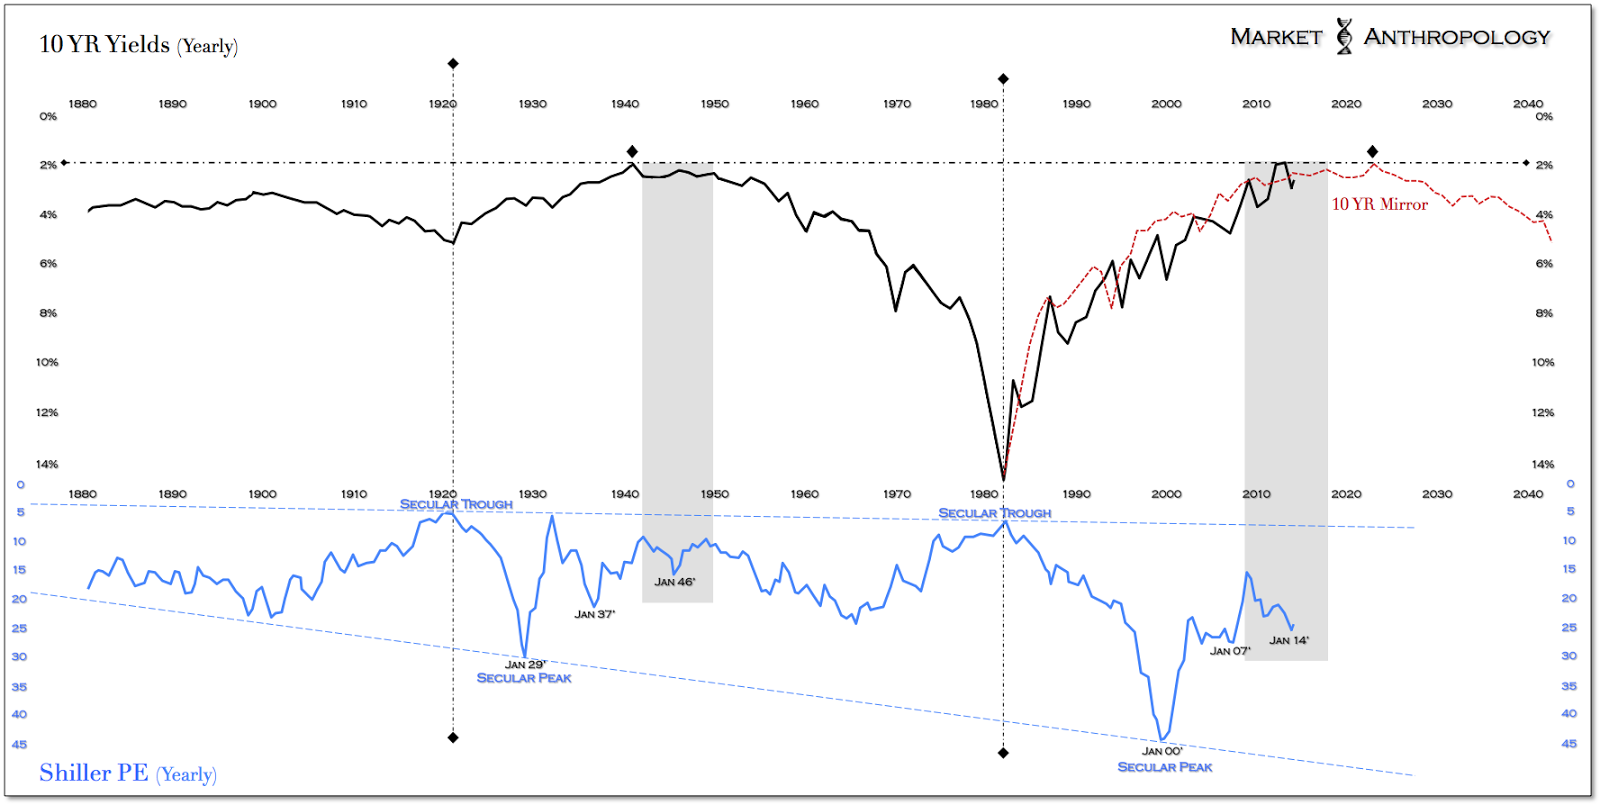
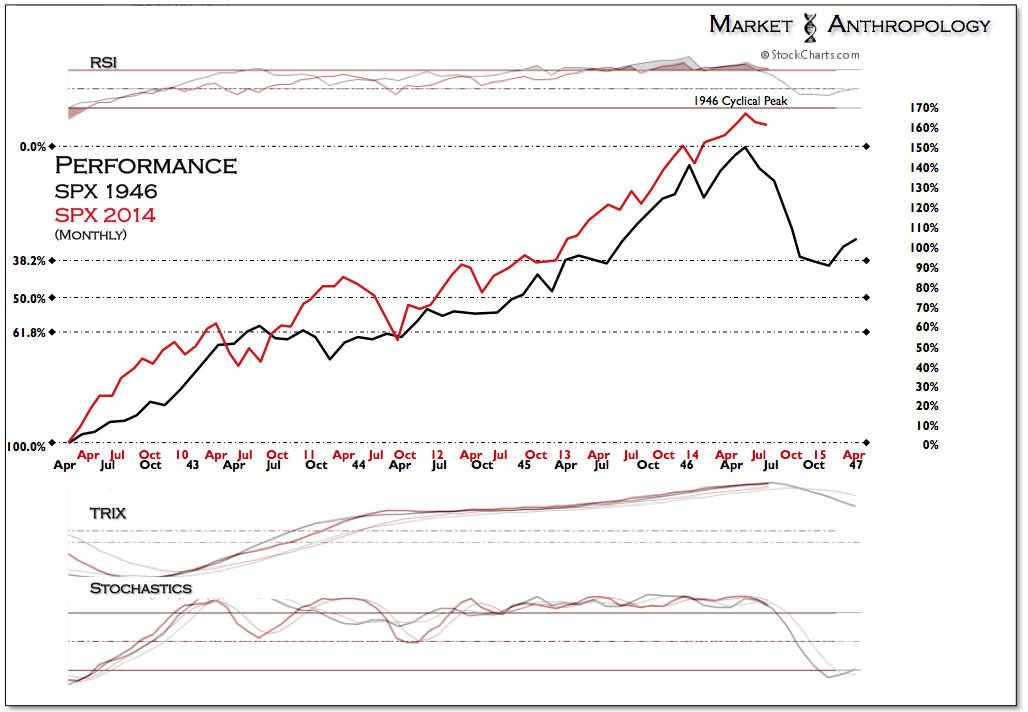
Generally speaking, we've approached the broader macro picture in the US equity markets from the top down bearings of the long-term 10-year yield cycle and the proportional trends of Shiller's P/E ratio - which we have described in previous notes (see here) as sharing close parallels with the cyclical peak in equities in 1946. Although the trend in equities did extend further than we anticipated at the start of the year, similar market and policy conditions still exist that hold strong congruencies with this historic time period. This perspective remains supported by:
- The long-term yield backdrop - which we would argue primarily drives the boat from a valuation and asset cycle point of view and is similar to the range in yields witnessed in the mid 1940's. Yields currently reside on the mirrored return of the 80 year cycle - which would extends the range (~1.5-3.0%) of this extremely low yield environment further out than is currently considered.
- The current disposition of Shiller's P/E - which our trend analysis would indicate has a low probability of exceeding the proximate and previous cyclical peak in 2007.
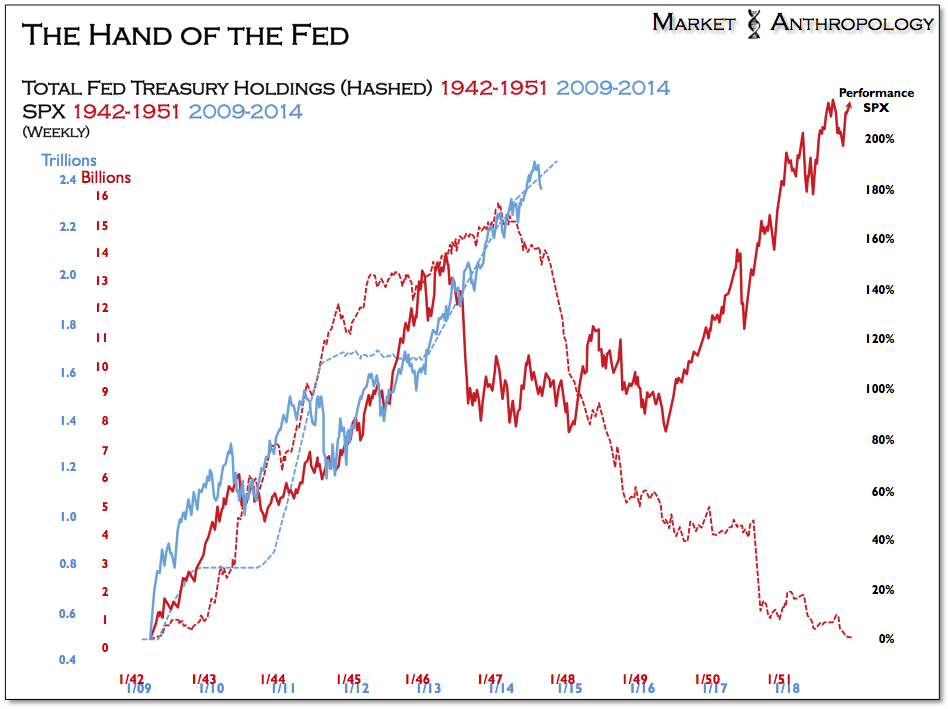
- Similarities in extraordinary measures in monetary policy between today and the 1940s - which saw the Fed purchase and hold all available short-term U.S. Treasuries and virtually all long-term U.S. Treasuries. We expect a similar outcome in the markets to the normalization of current monetary policy, which from our perspective would likely push an actual rate tightening cycle further out than is currently considered.
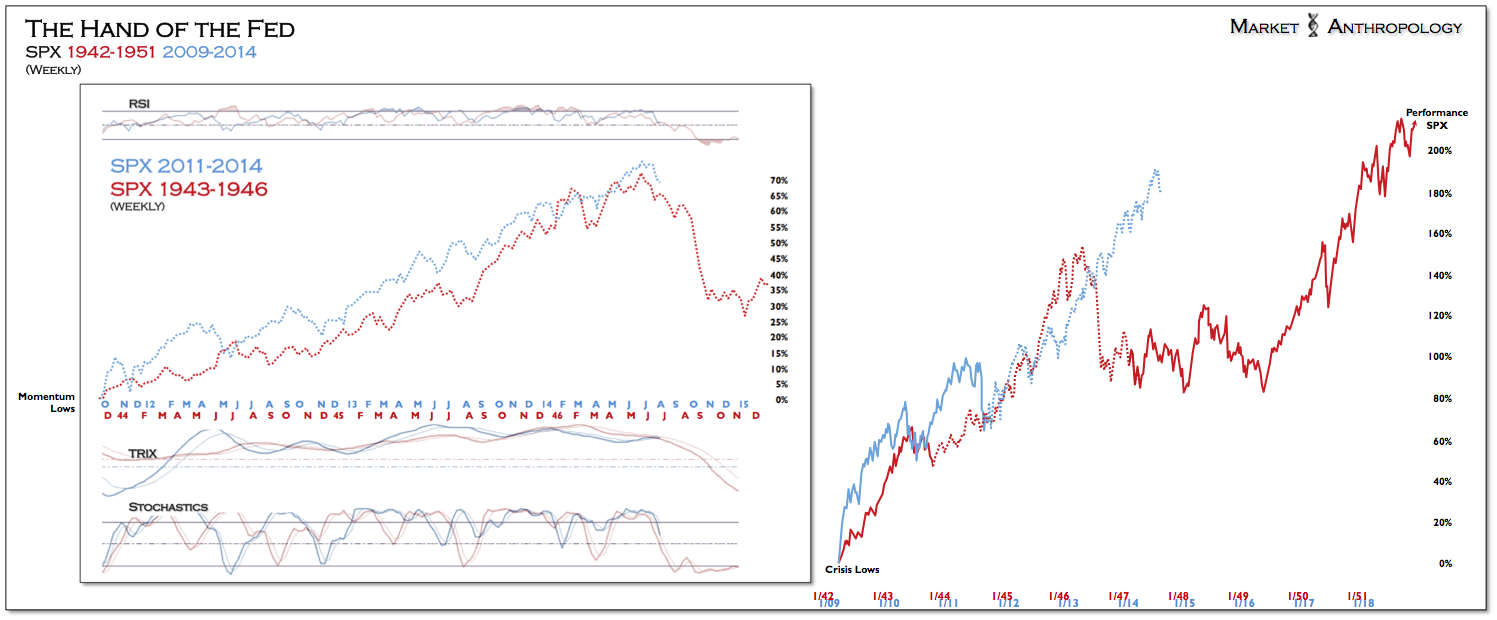
- Similarities in equity market performance since the Fed started visibly supporting the markets at the previous cycle lows in 1942 and 2009. Although the composite duration in policy support extended from the Fed has been longer today, it was intermittently halted on two occasions over the past five years. Taking into account these pauses between QE salvos, comparisons between the two equity market cycles are commensurate.
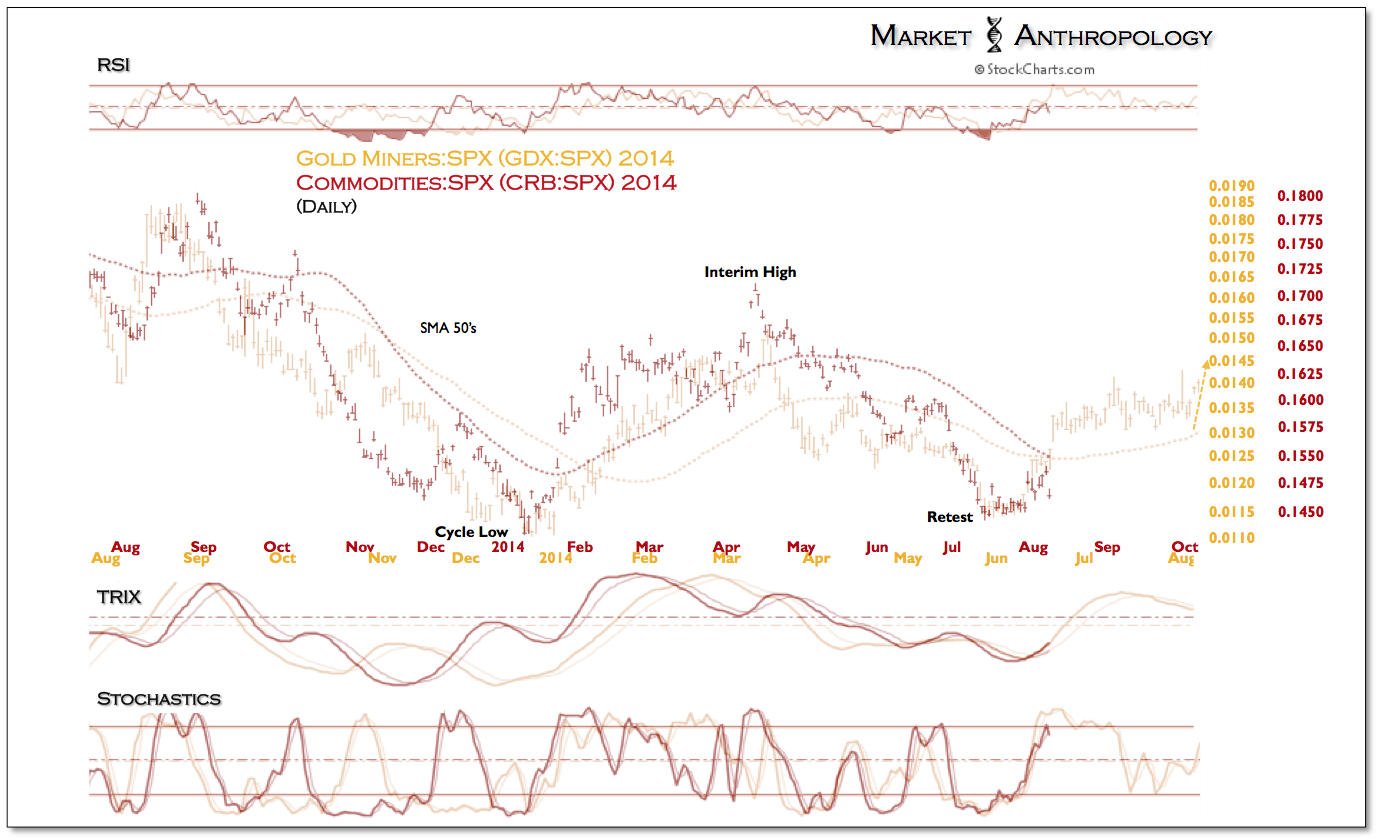
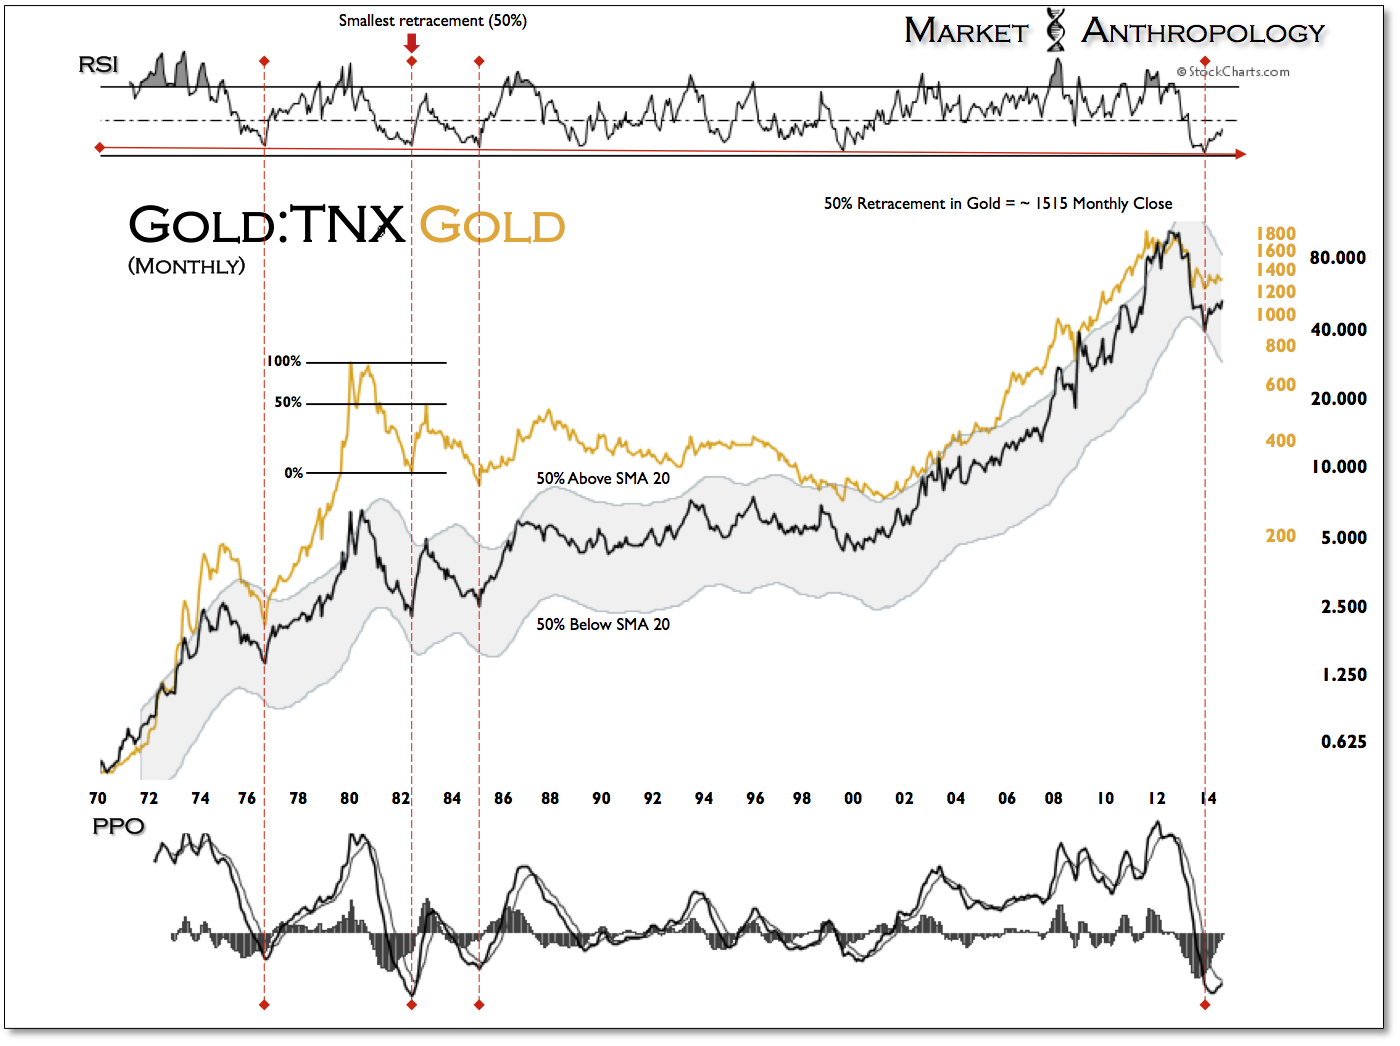
- The pivot higher in the commodity markets this year, which was also dramatically evident when the Fed pivoted from its outright purchase of securities in the market at the end of 45' and extended the commodity cycle to its cyclical high in 51'. Generally speaking, we view the bid in the precious metals sector this year as the leading edge for the broader commodity space and find efficacy in the Fed's policy pivot - which signaled to the markets a trend change in inflation expectations.
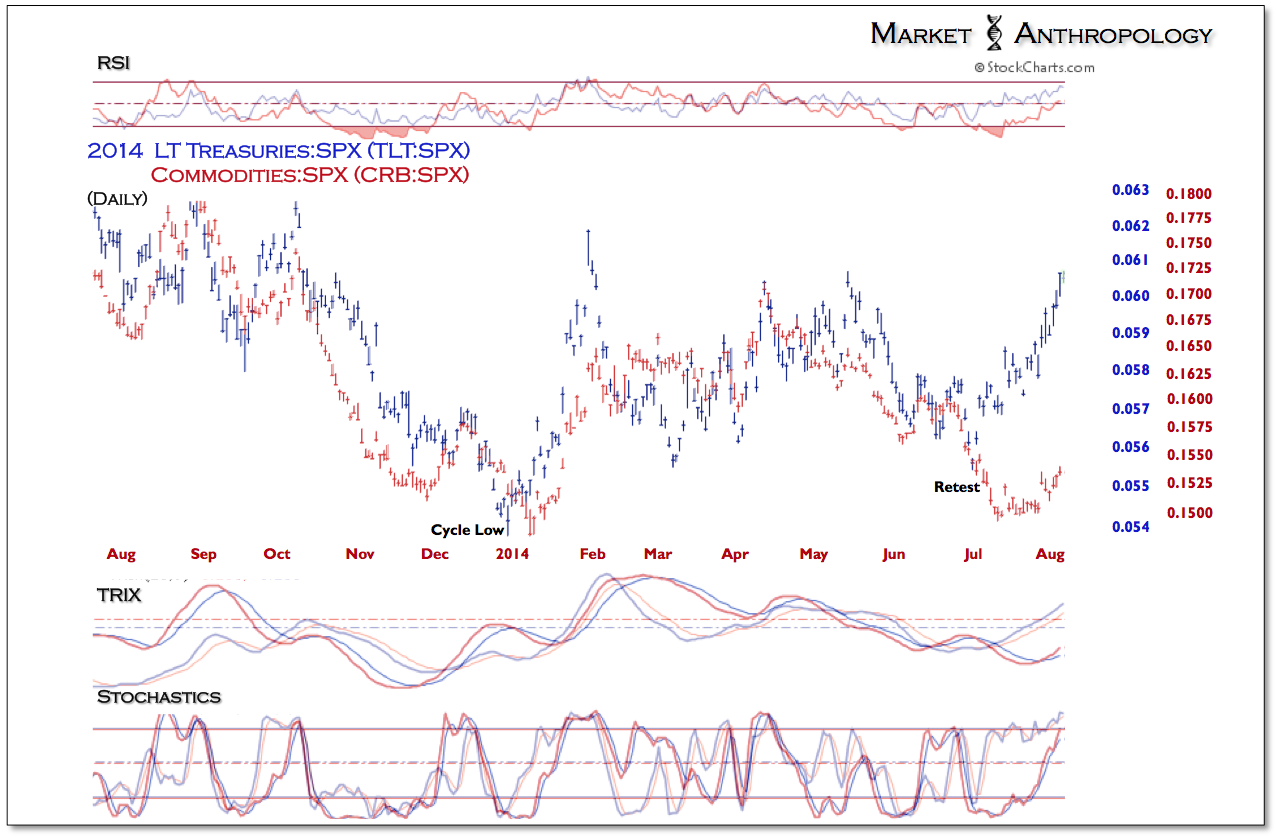
Just as the policy shifts by the Fed in the mid 1940s sparked the unique conditions in which long-term yields declined with a rejuvenation in commodities and inflation (see here), a similar dynamic has developed since last December in precious metals, commodities and those reflationary assets closely associated with their respective performance trends.
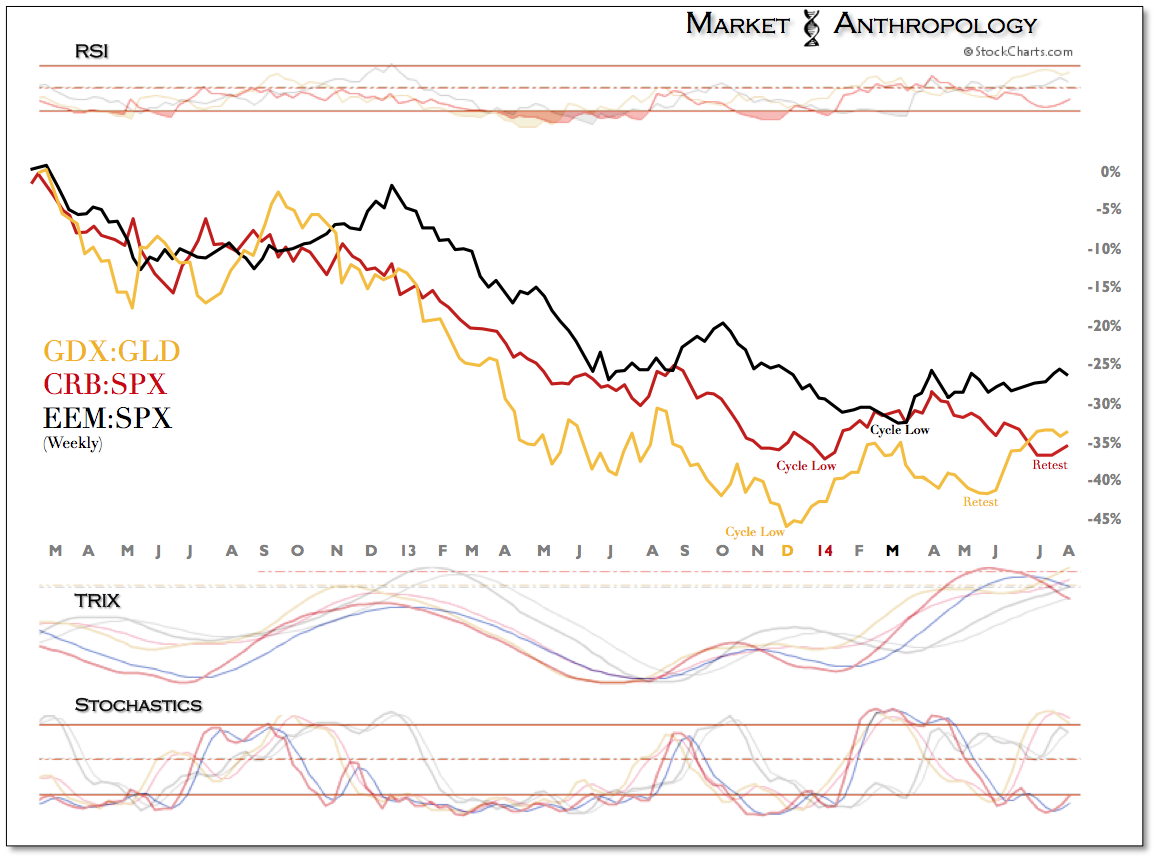
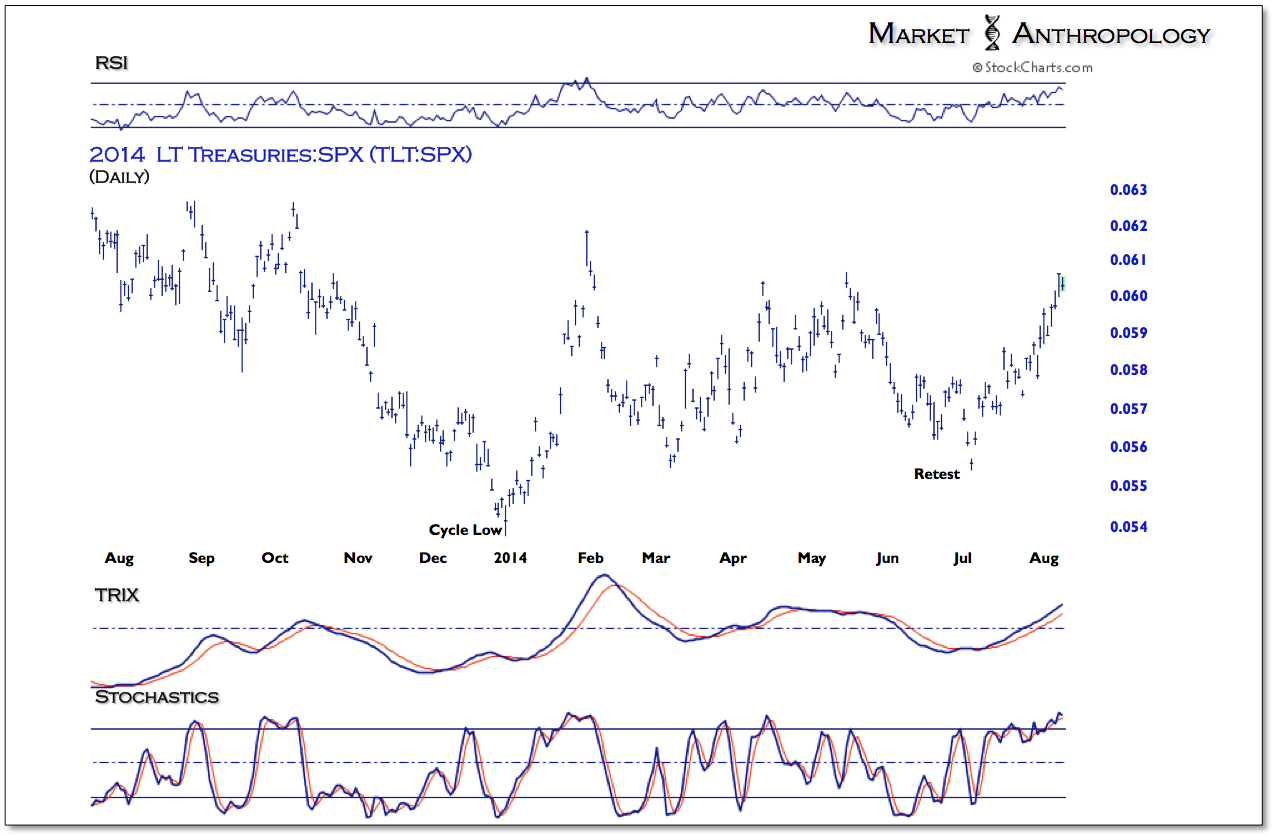
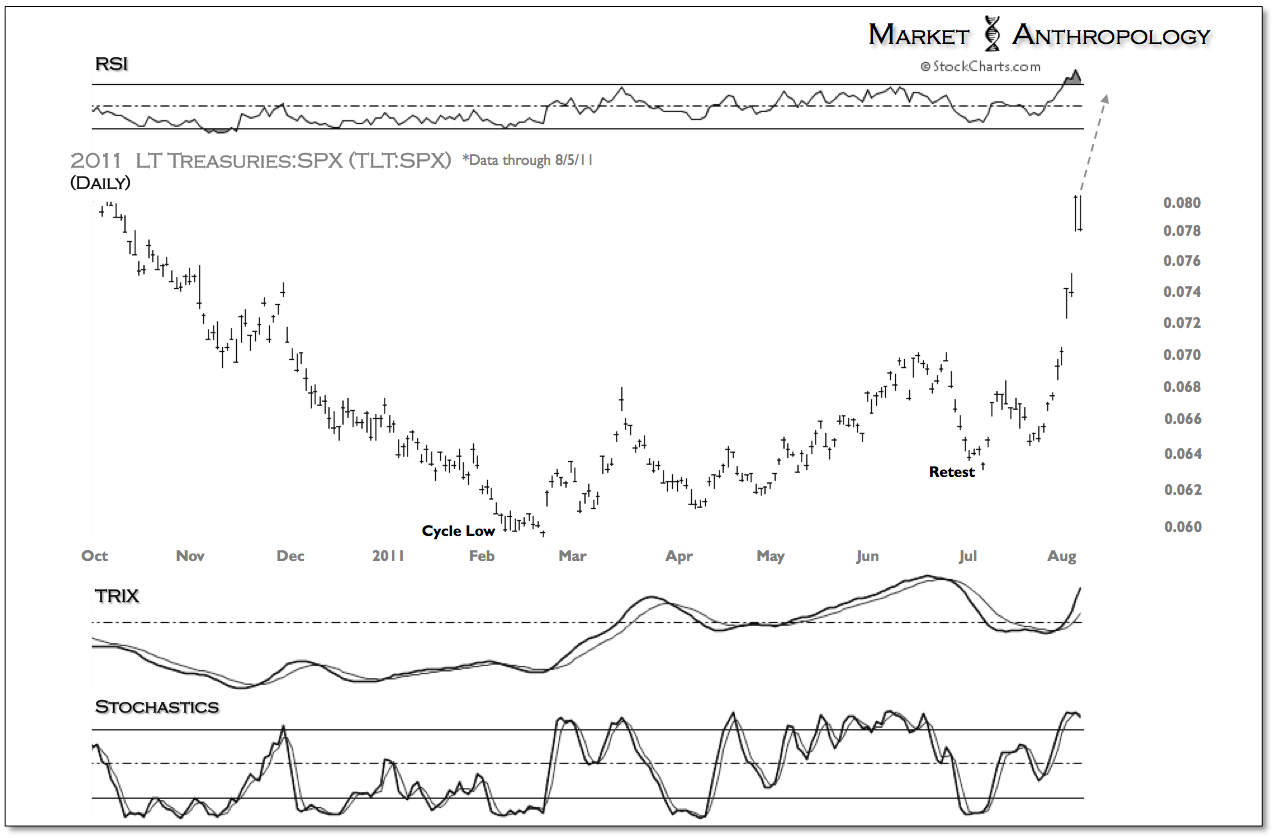
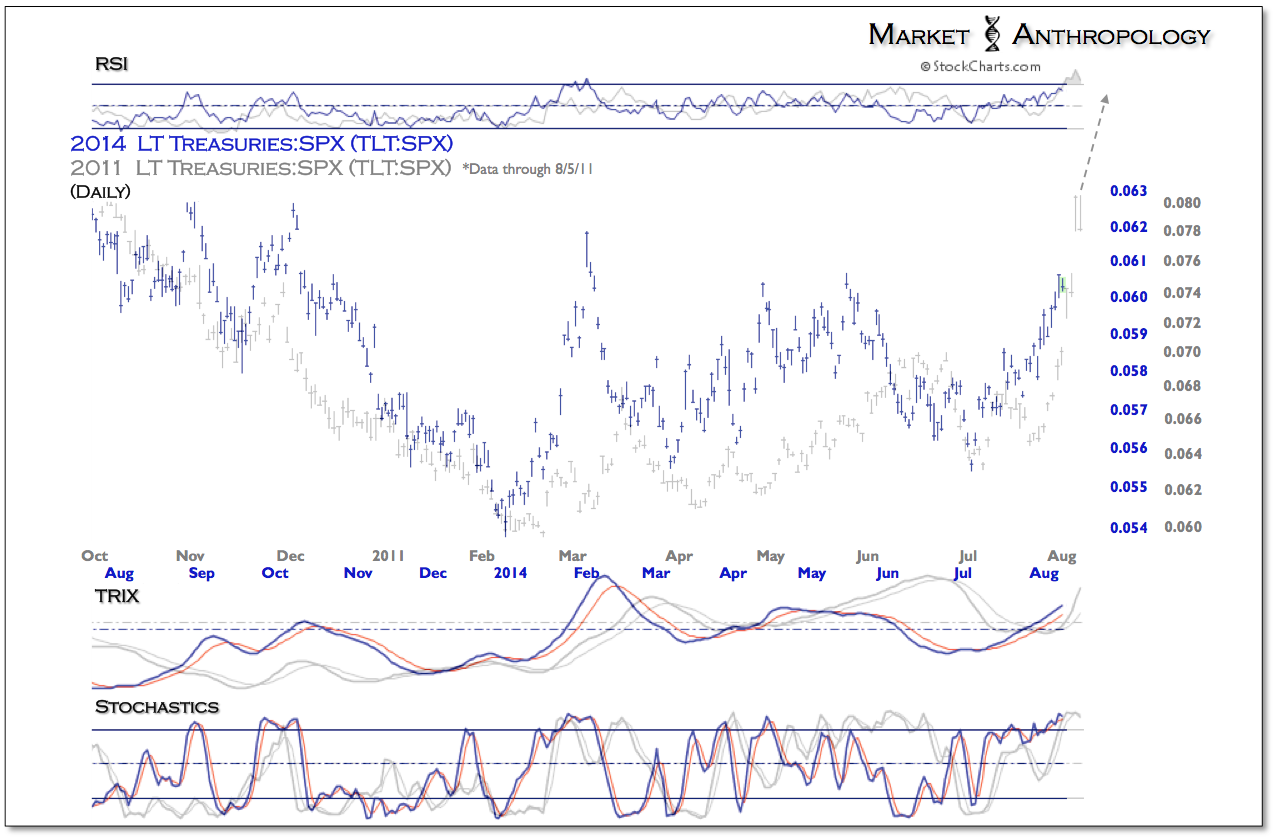
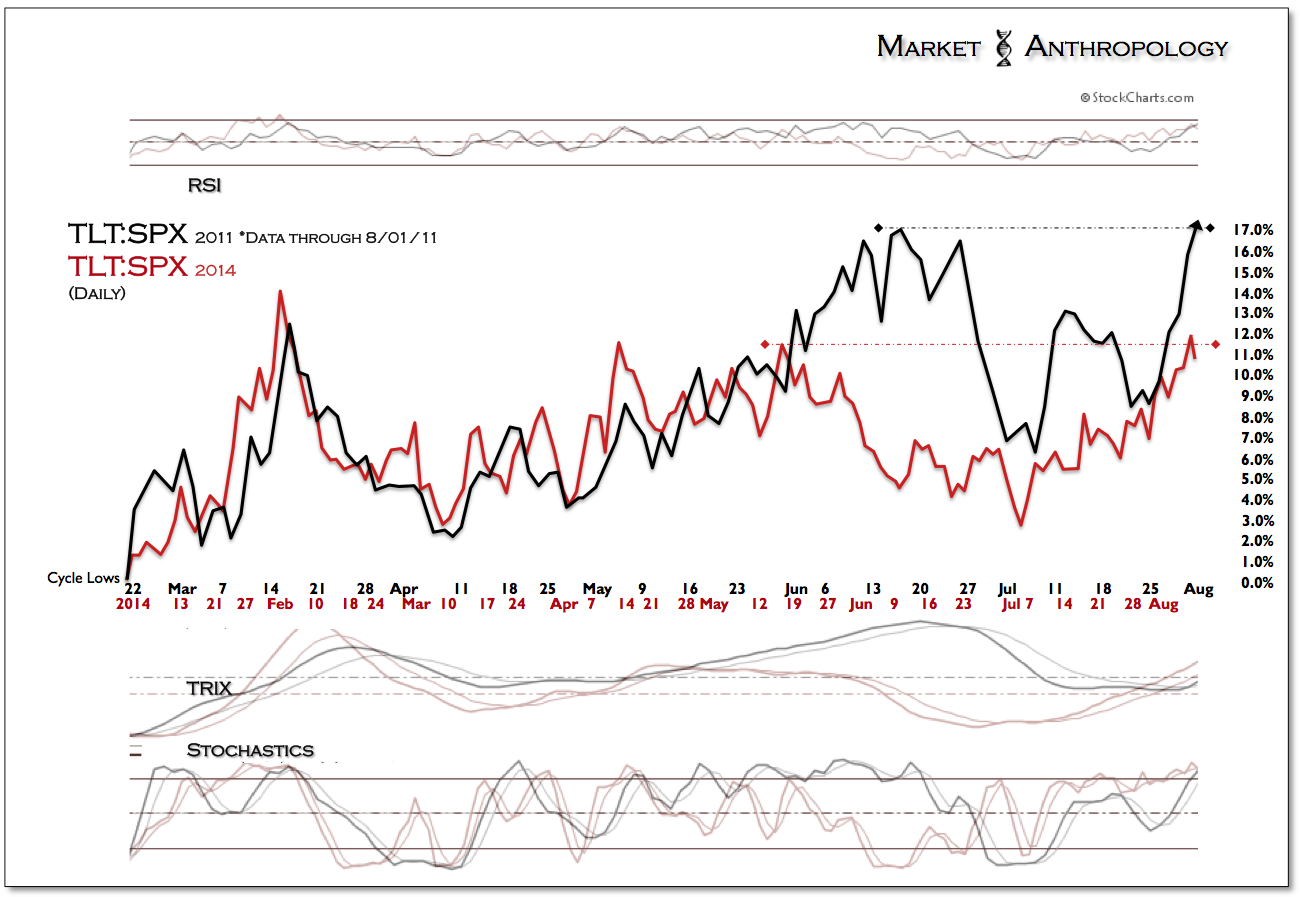
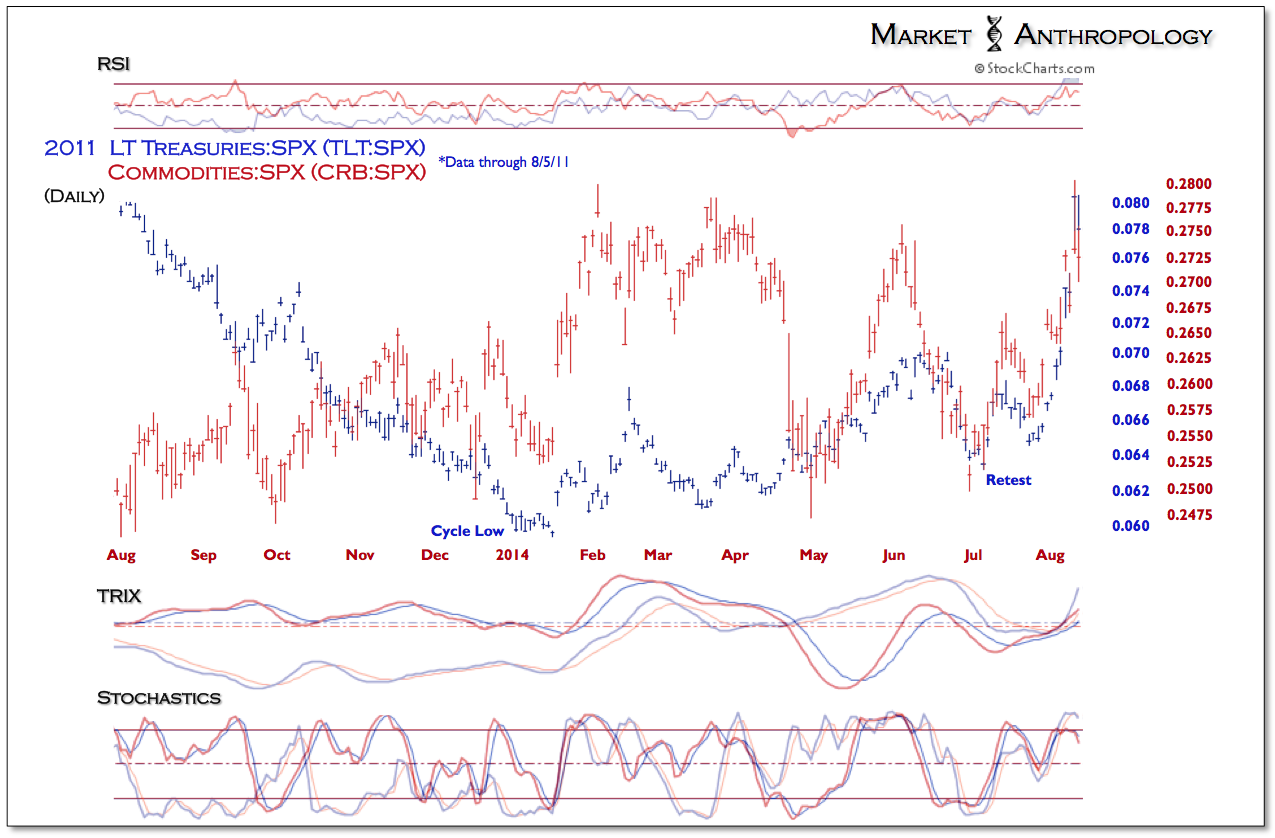
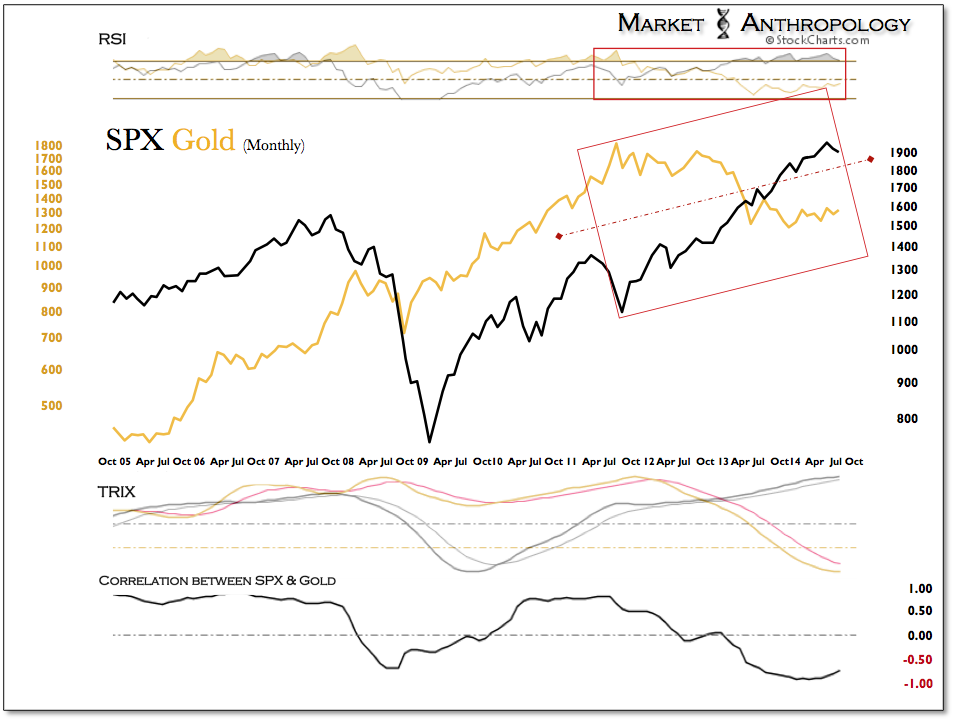
While there are parallels to the wind down of QEII in how long-term Treasuries relative to equities have performed this year, the biggest difference in our opinion - and one we cite as indication of effective demand with policy, is the fact that gold and the broader commodity complex based and pivoted out of a cyclical low last December when the Fed moved to taper. This was largely contrarian to what most participants believed would occur as the Fed walks away. From our perspective and as we had noted last year before the initial taper, these developments ring true if policy accommodations were being withdrawn a final time - and if underlying conditions were in place to sustain reflationary forces.
These set-ups are greatly divergent from what was present in 2011 as the Fed ramped - then wound down QEII. Back then, the commodity sector - led by silver and gold, had surged higher on the misplaced notion that inflation would rue the day because monetary policy was far too accommodative. The harsh reality was soon proctored by the markets which saw those assets closely tied to inflation expectations peak in the wake of QEII and begin a long disinflationary downturn and wide underperformance to the S&P 500.
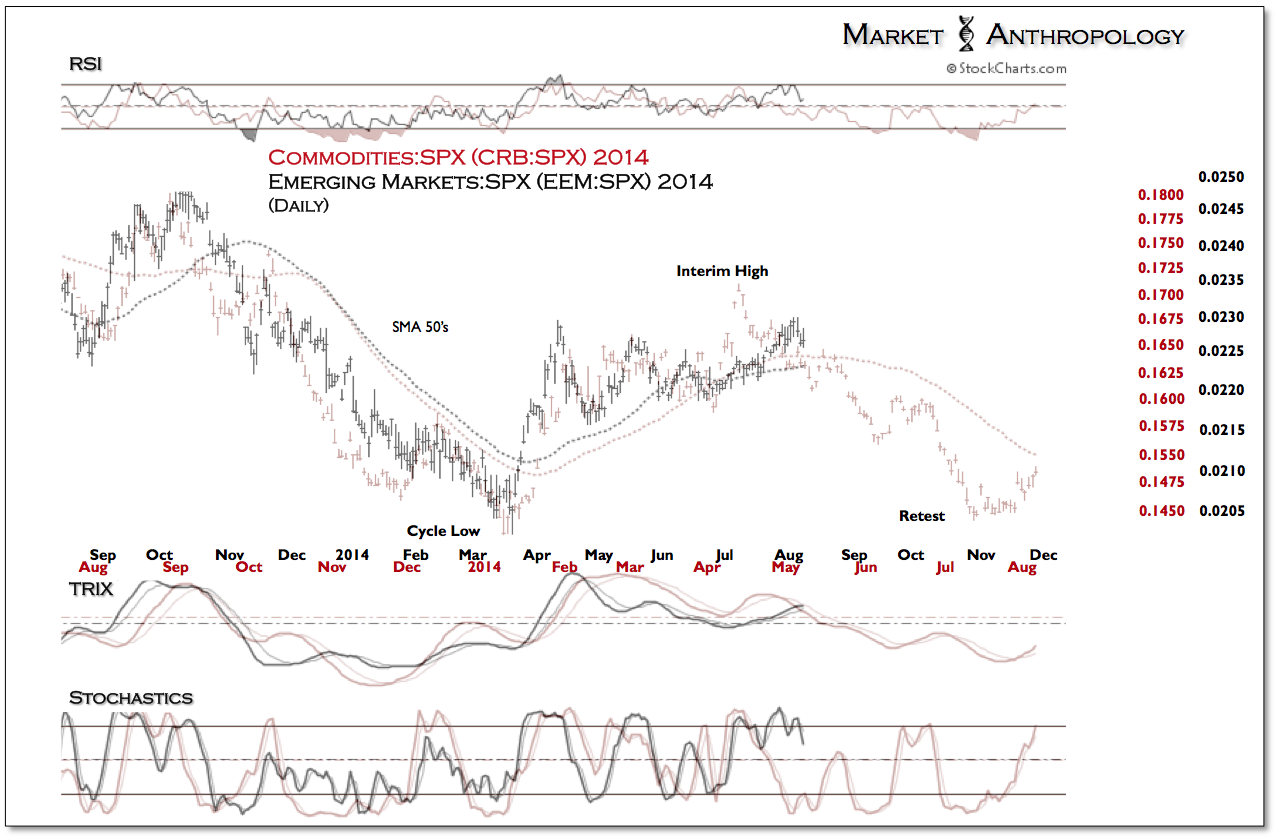
Today, as the markets work through the structural and psychological frictions of a normalization with monetary policy, demand for long-term Treasuries should remain supported - as well as reflationary trends in precious metals, commodities, emerging markets and Chinese equities. With that said, and as noted throughout the year, there has been a lagged sequence out of these assets cyclical pivots and respective interim highs and lows.
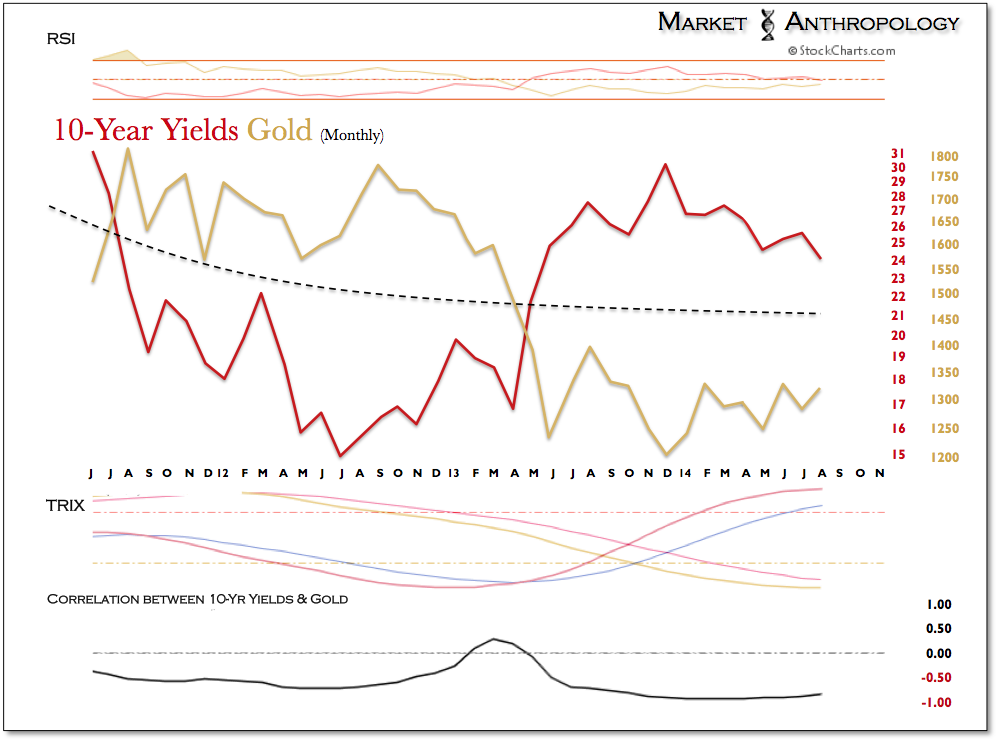
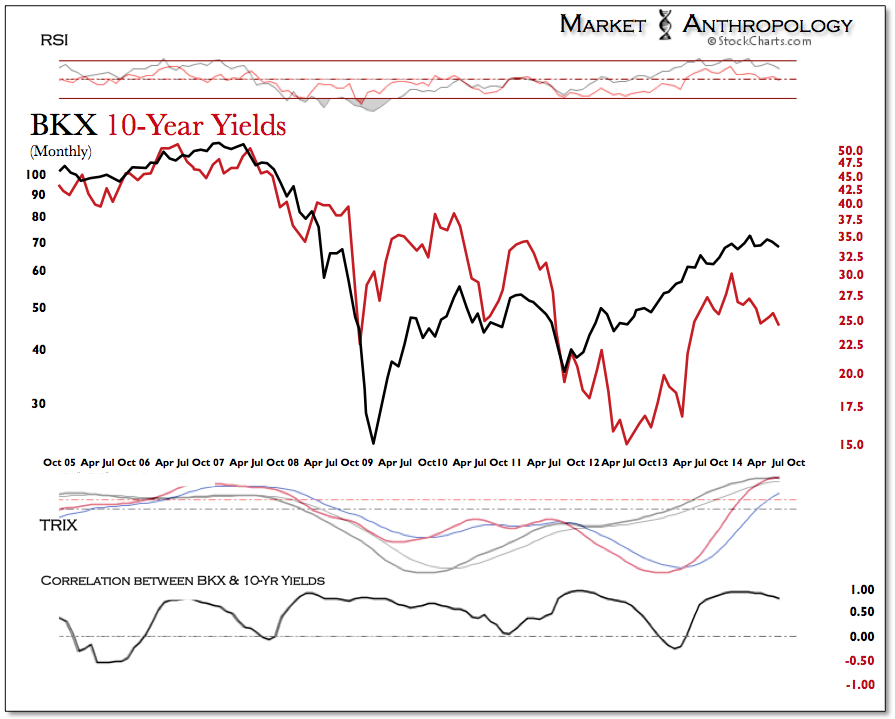
In our opinion, the biggest development recently - besides cracks developing in the equity markets, is the further breakdown in 10-year yields, which should release the next leg higher in gold and draw the broader commodity complex out of an interim low. At the same time, a declining yield environment should present a strong headwind for the financial sector - that up until this spring had led the broader market higher. All said, ramifications by the audience to the Fed turning their extraordinary stacks of amps back down. It's still loud out there - but it's not 11.

