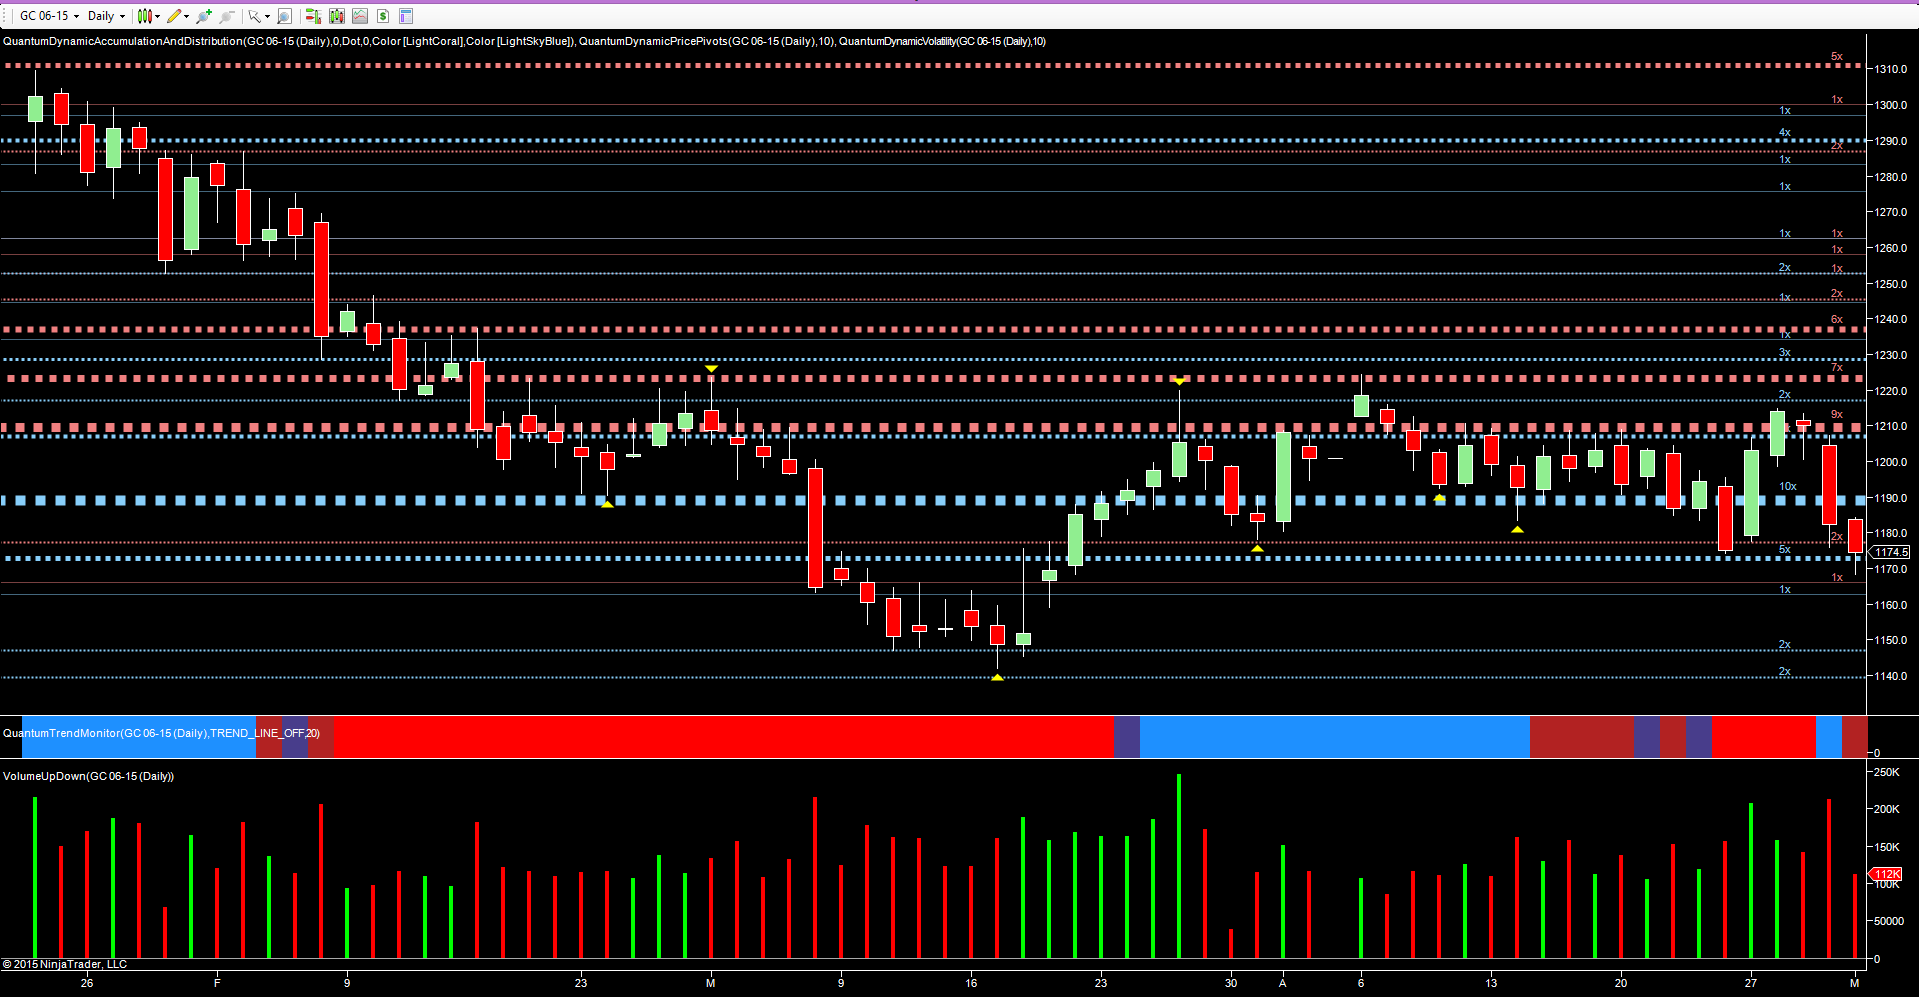
It was an interesting week, to say the least, for gold traders and investors, with the former no doubt enjoying the dramatic and volatile moves intraday, but with the latter wondering whether the precious metal will ever reverse from its long term bearish trend and return to the halcyon days of ever rising gold prices. Last Monday’s price action promised much, with a wide spread up candle, promptly reversing the previous Friday’s losses and surging back above the resistance level at $1190 per ounce to close at $1203.20 per ounce. This bullish sentiment continued into Tuesday, albeit on falling volume with the price action just managing to breach the resistance at $1210 per ounce, thereby giving longer term investors hope this could be the start of some sort of recovery.
However, Wednesday’s price action failed to follow through, and indeed closed as an inside candle on the daily chart, before Thursday’s dramatic move when the gold bears once again took control, sending gold prices crashing through the $1190 per ounce support region, accompanied by high volume and validating the move lower.
Friday’s price action followed through with further selling, but on lower volume as the platform of support in the $1174 per ounce region was duly tested before gold closed the week at $1174.50 per ounce.

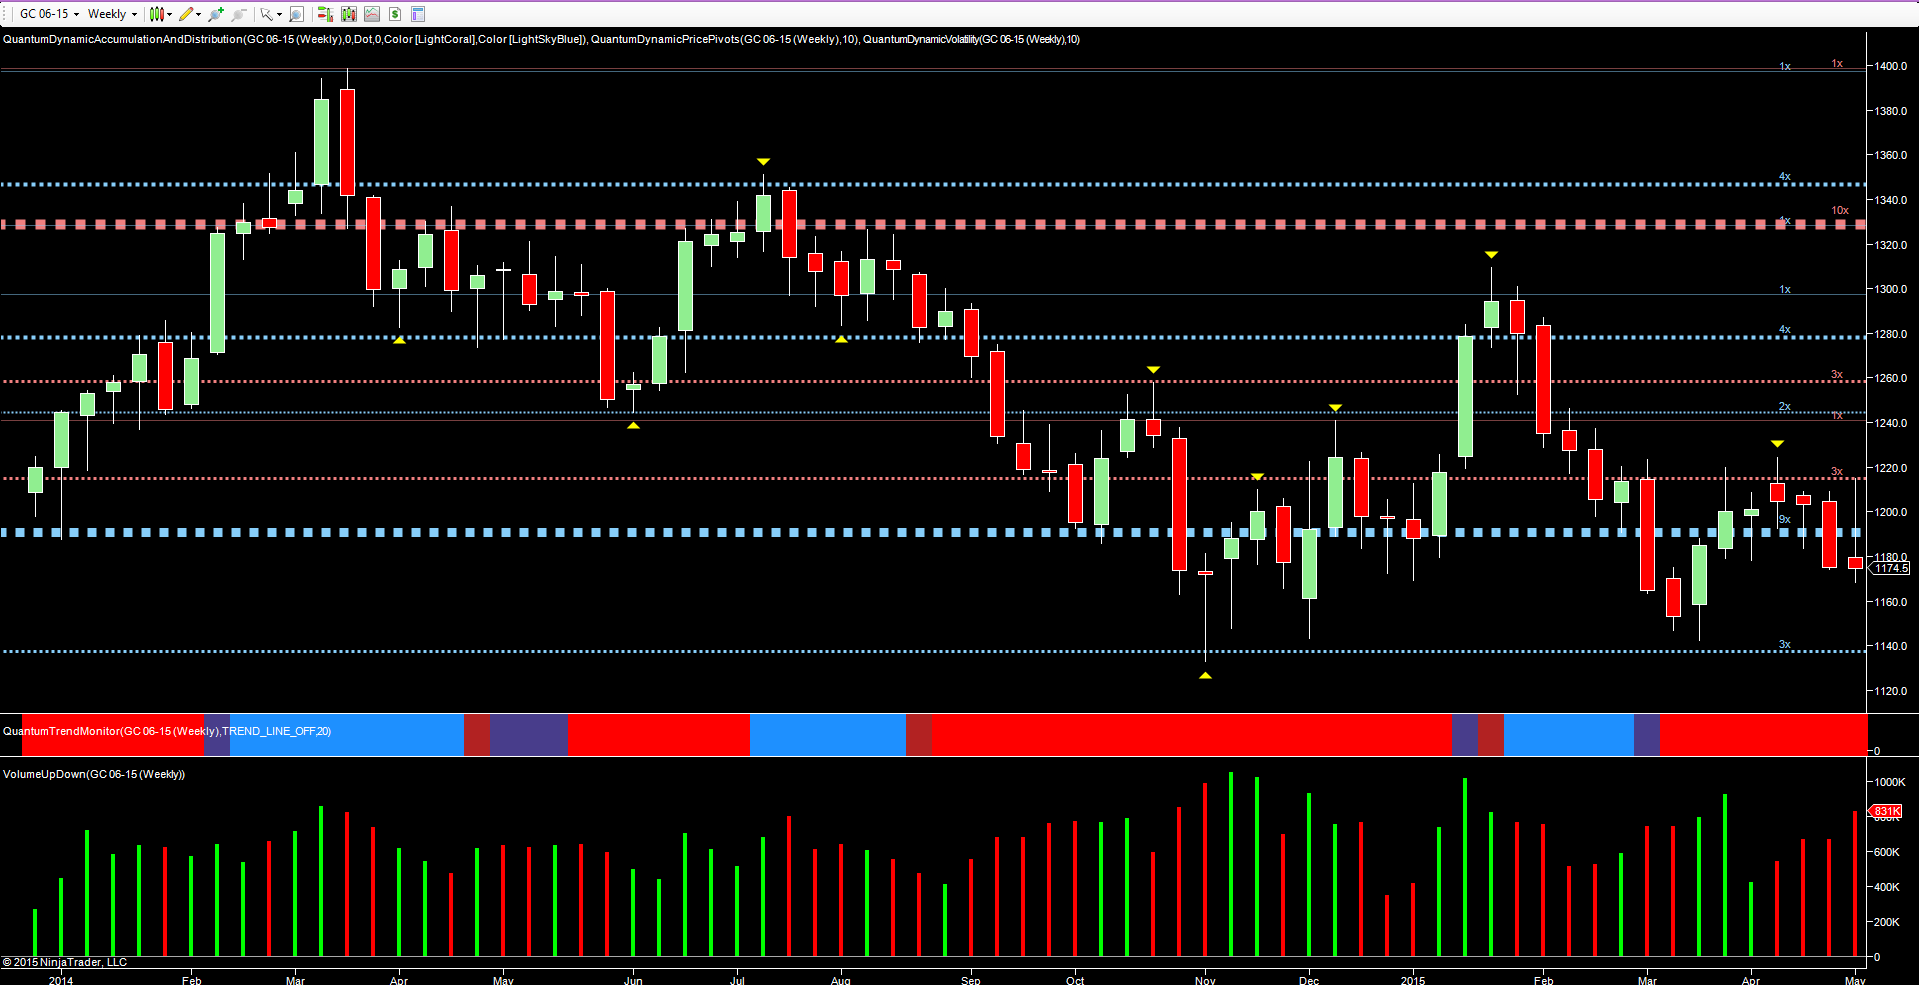
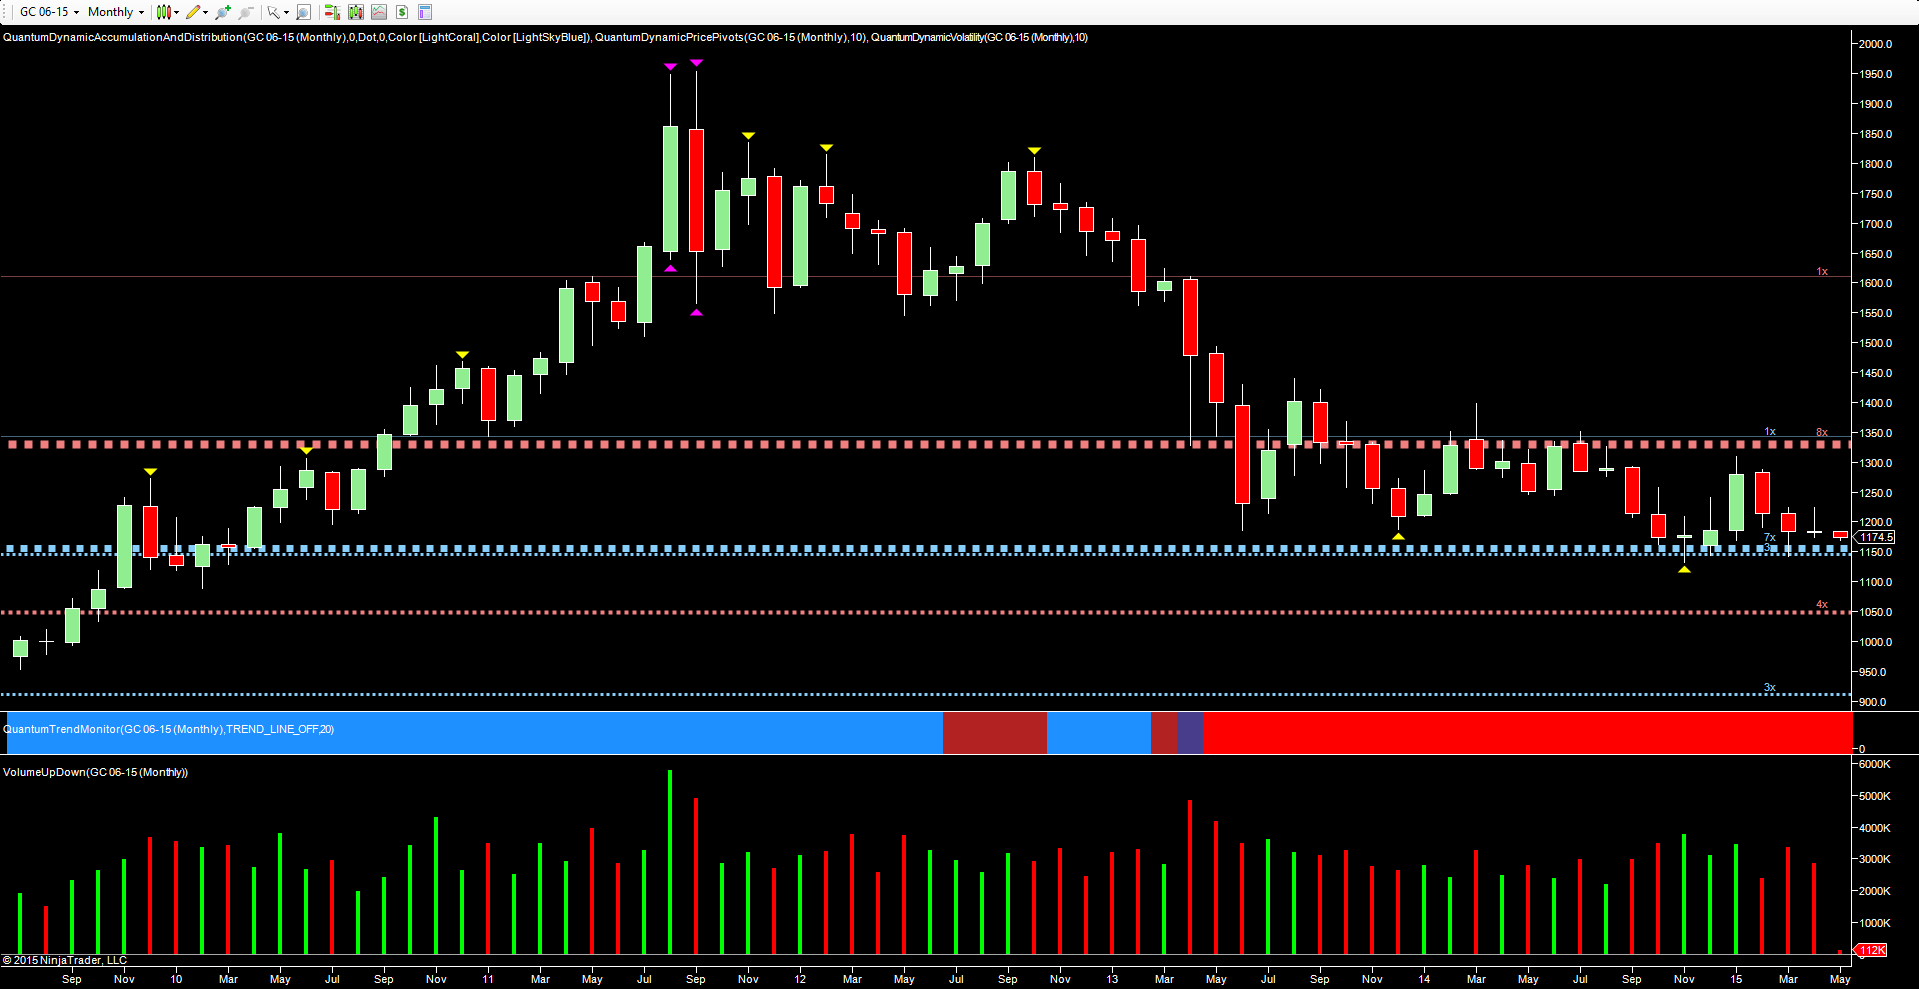
All of this is neatly summed up on the weekly chart, above. Having now closed the week firmly below the platform of support in the $1190 per ounce region, gold looks set to pick up the bearish momentum longer term once again, with $1140 per ounce now the next logical target. Any move below this level will then open the trap door to a sustained and longer term move lower. For evidence of that, we need only consider the monthly chart where this level has been tested on numerous occasions over the last few months. If it holds, then we can expect a bounce higher, but if it is duly breached then, as I have said many times before, the trap door will open and the drop to $1050 per ounce will begin.

In summary, the price action of the last few months is nothing more than an extended phase of price congestion on the longer term chart which neatly provides a perspective for longer term investors. As yet there is no evidence of a buying climax, and until then the longer term outlook remains bearish for investors.
However, for intraday gold traders, this current period of price behavior offers almost unparalleled trading opportunities, both to the short and long side. And as always it’s a case of trading what you see on the chart and not what you would like to see.
