
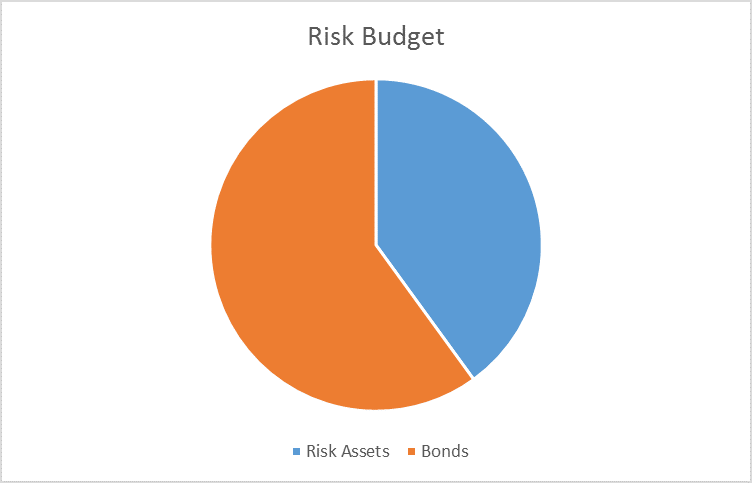
The risk budgets are unchanged again this month. For the moderate risk investor, the allocation between risk assets and bonds remains at 40/60. It was tempting to raise the risk allocation this month and up our allocation to the weak dollar investments we’ve favored for some time. But the only indicator that really improved was credit spreads and it was not sufficient to break the widening trend. There wasn’t enough change in the other indicators to justify increasing our risk posture.
As I noted in the most recent Bi-Weekly Economic Review, the US economic data has recently turned softer, with negative surprises far outnumbering the positives. Q1 GDP was weak and so far I see no reason to expect Q2 to be any better. Inventories are still too high, investment is still too low and the two areas that have been positive for growth – autos and housing – are slowing. Residential investment was a positive for GDP in Q1 but recent reports show slowing housing starts and permits. The auto industry, like a lot of others, has an inventory problem and sales peaked months ago. This economic weakness is a continuing source of concern and has been a major factor in the US dollar decline – a decline that has played a large role in determining investment outcomes this year.
Indicator Quick Review
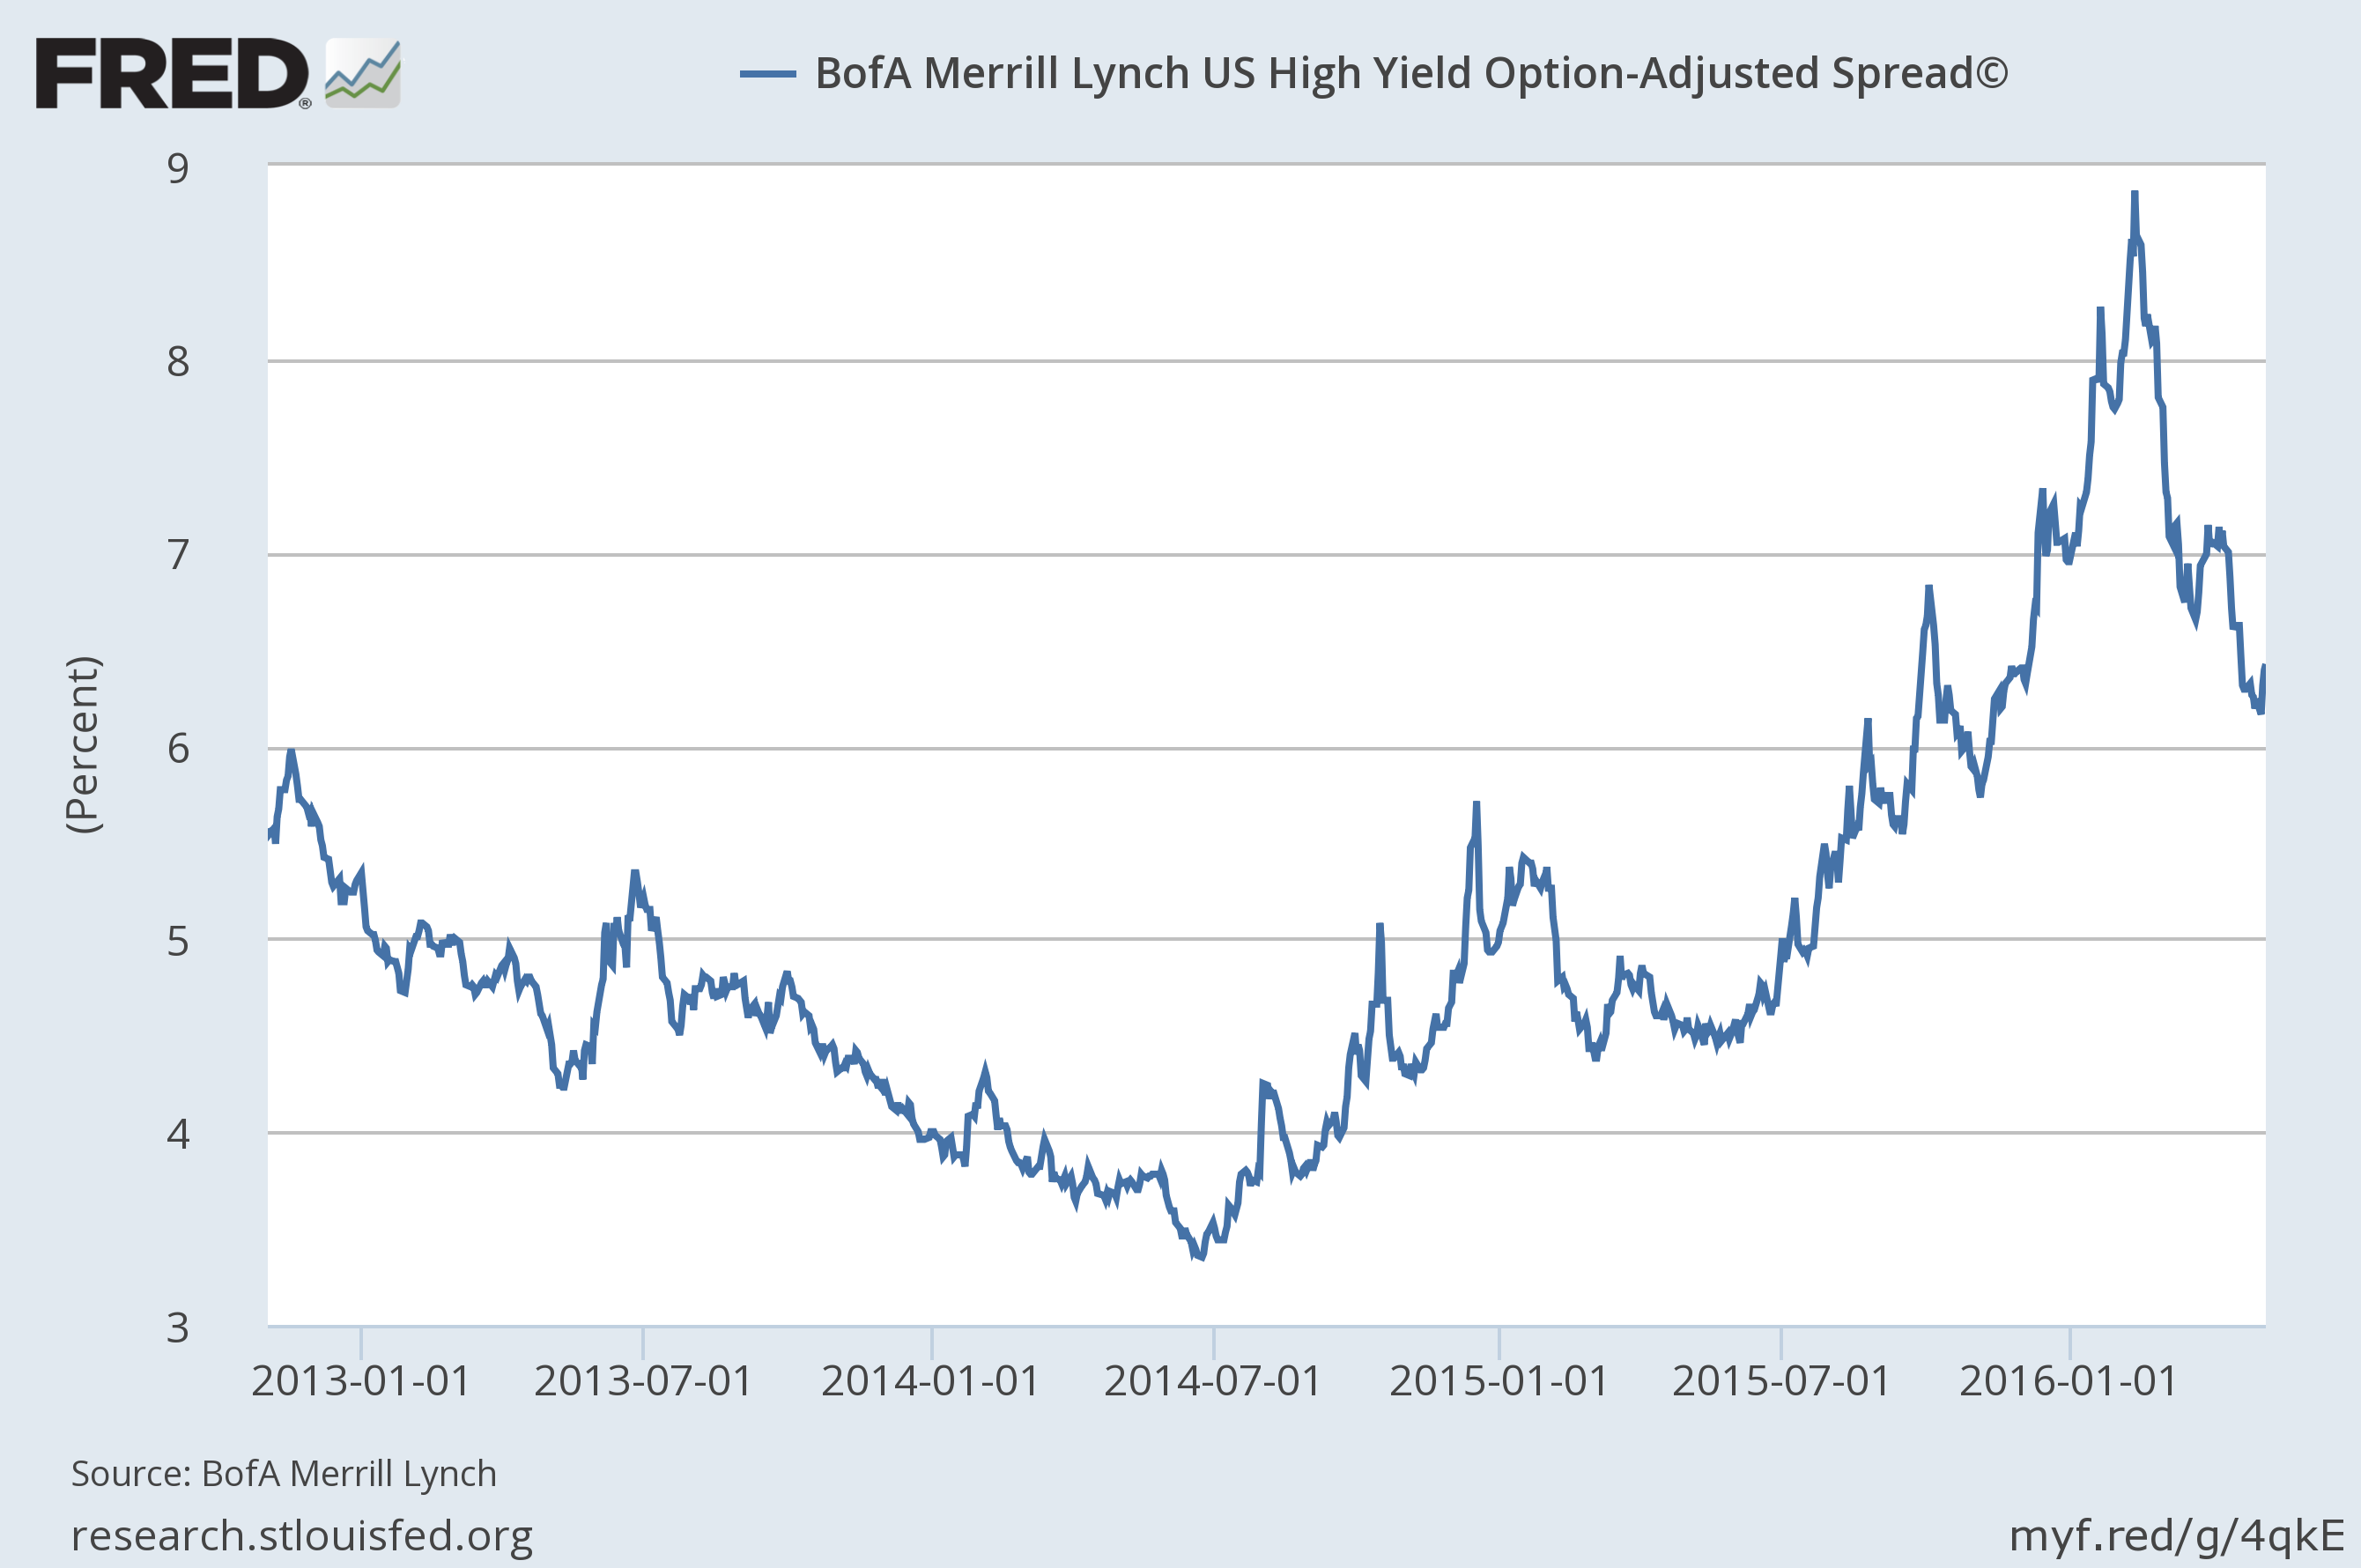
Credit spreads continued to narrow over the last month ending at 6.48% versus the 7.15% in the last report. While that is a fairly sizable move for one month, it does not change the longer trem trend which is still toward wider spreads. In general spreads moved in unison but there were a couple of interesting outliers which I’ll discuss below.
Valuations – US stocks remain very expensive with all the long term measures pointing to well below average returns over the next decade. Stocks outside the US generally continue to be the better value choice.
Momentum – Long term momentum for US stocks is still negative. Some shorter term changes in relative performance.
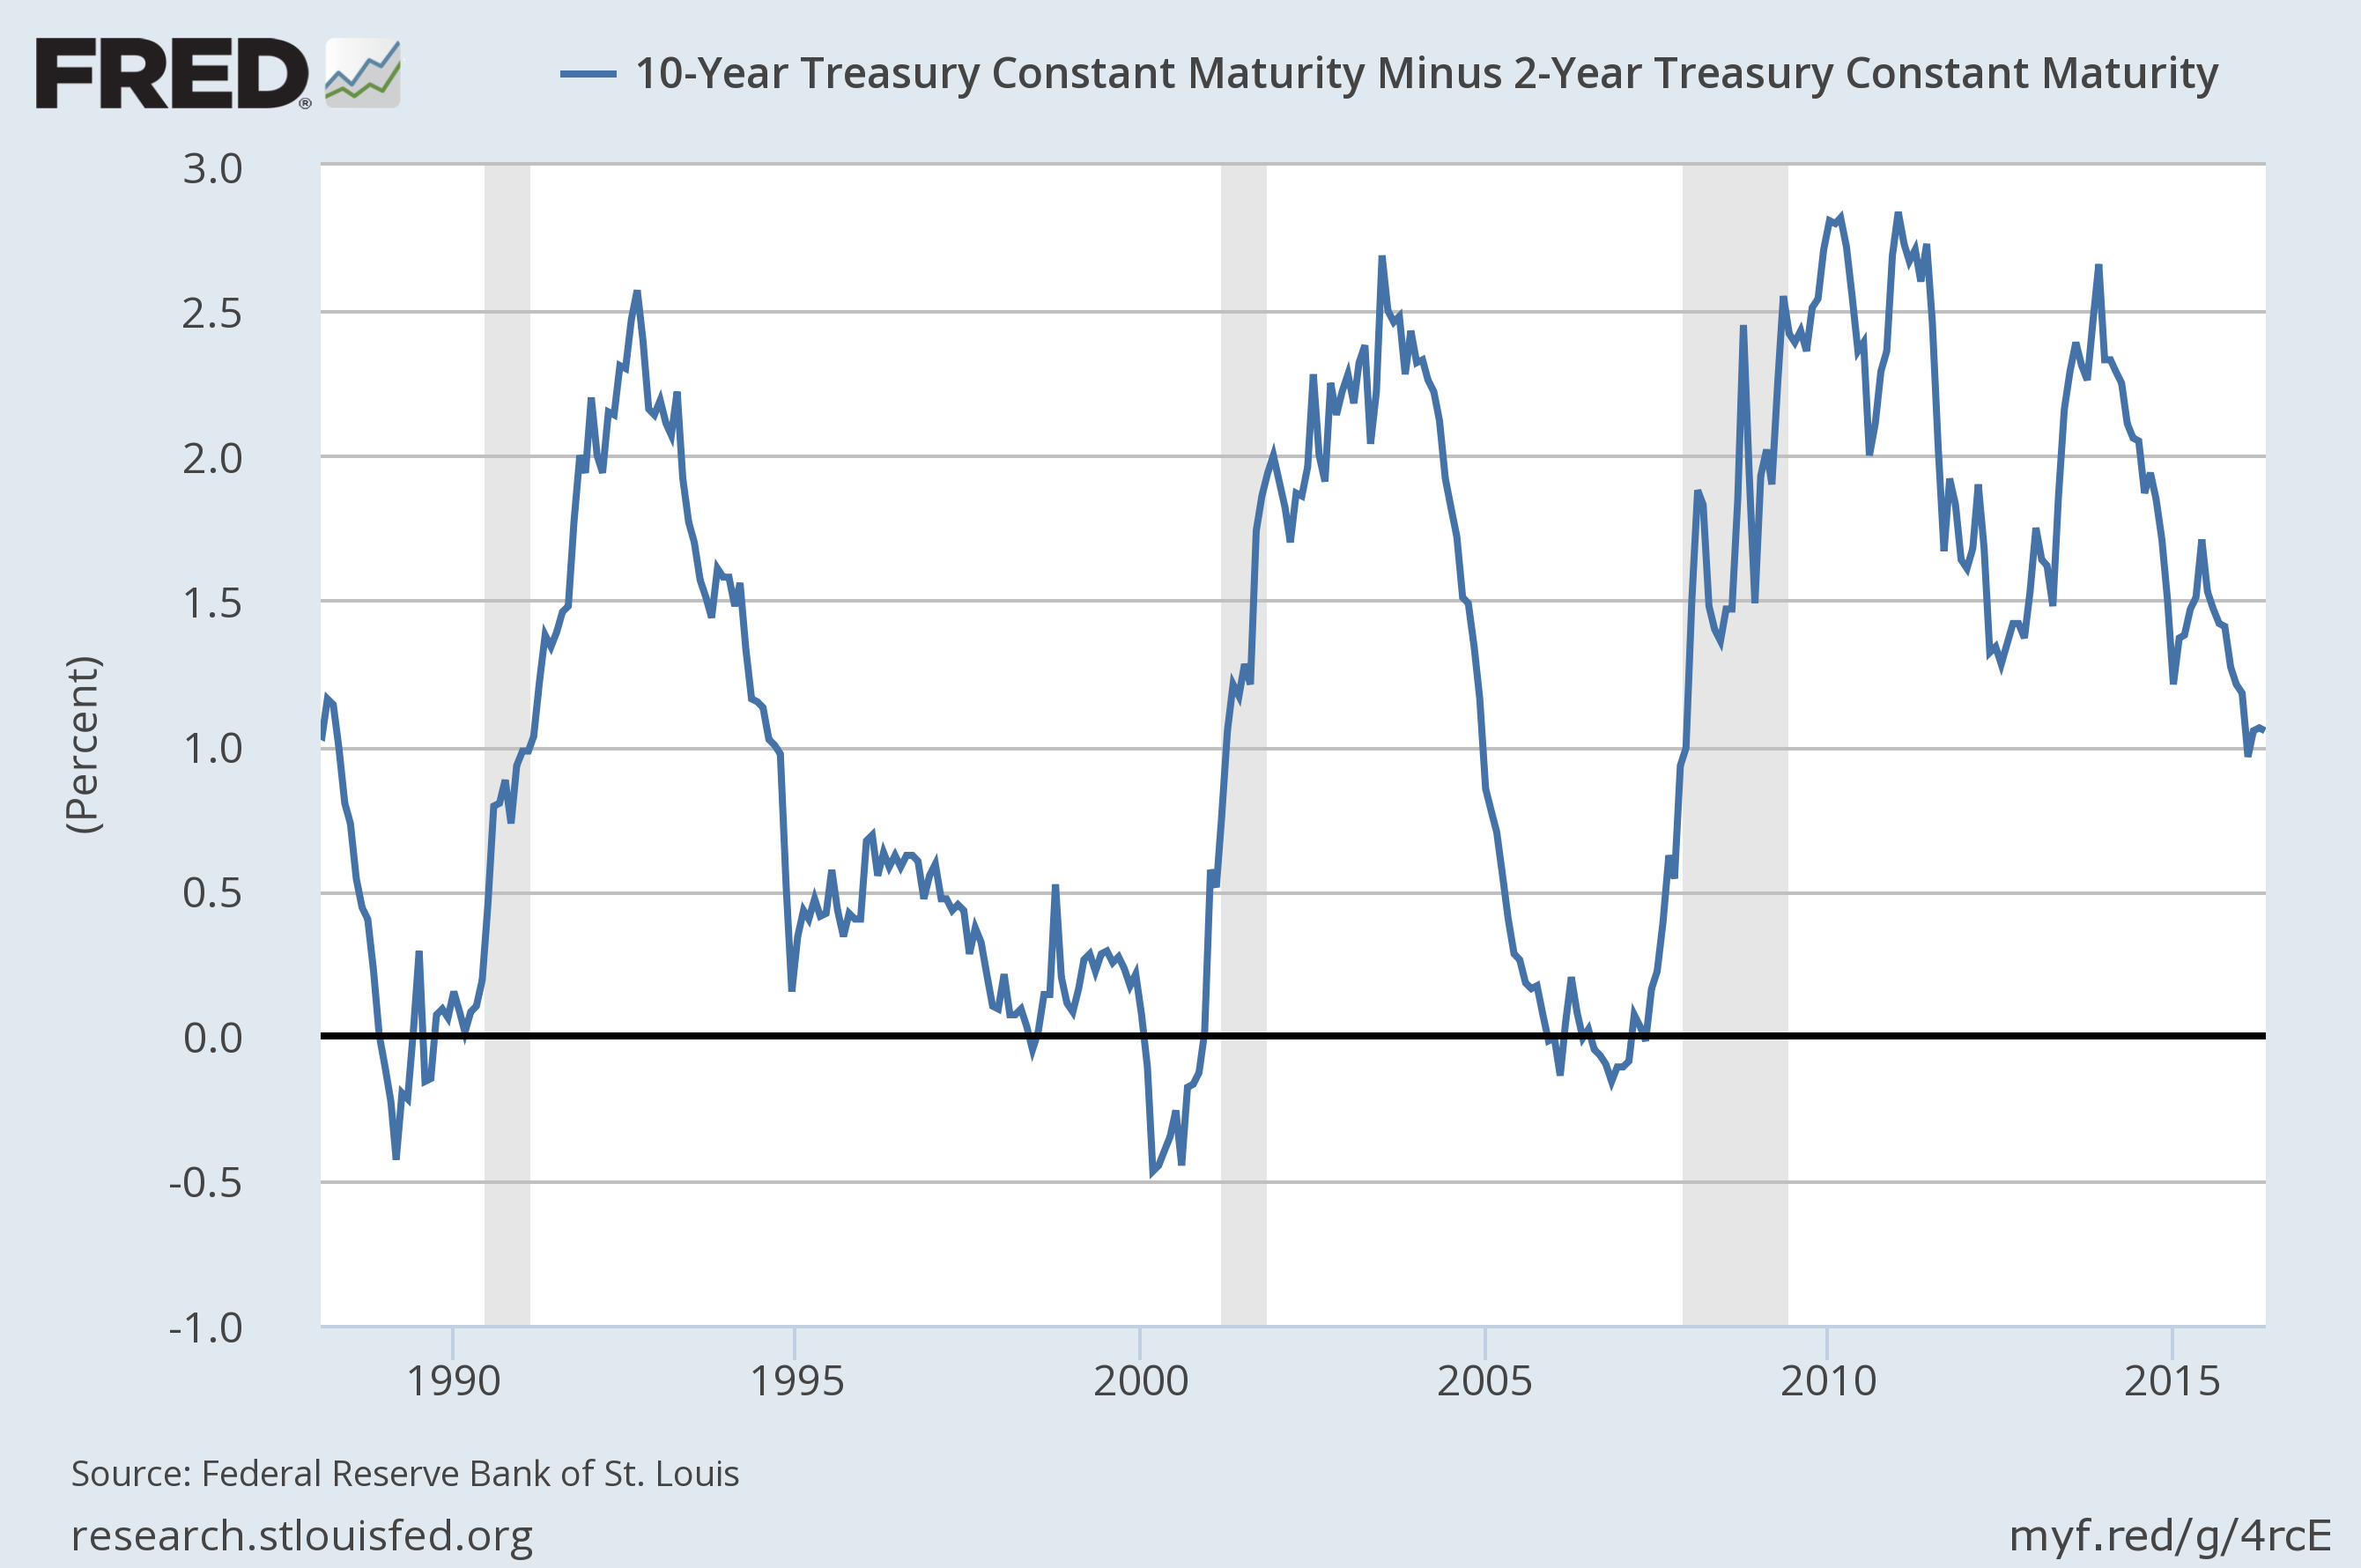
Yield curve – The yield curve actually steepened a bit during the month but the overall message is that the curve is no longer flattening and is nowhere near flat or inverted.
Credit Spreads
Credit spreads continued to narrow over the last month but not enough to break the trend. Spreads are moving in lock step with oil prices at this point, a mistake in my opinion. The credit cycle appears to have peaked and while energy may be the majority of the problem for now, it won’t stay that way if the economy continues to slow. Having said that, I was tempted – sorely tempted – to raise our risk allocation based on the recent narrowing of spreads. In the end I decided the breakdown in the dollar was not definitive enough to warrant increasing the international stock or commodity allocations. And if risk is added anytime soon that is where it will have to be since valuation and momentum are both currently negative when it comes to US risk assets.
Spreads narrowed last month but the widening trend is still intact.
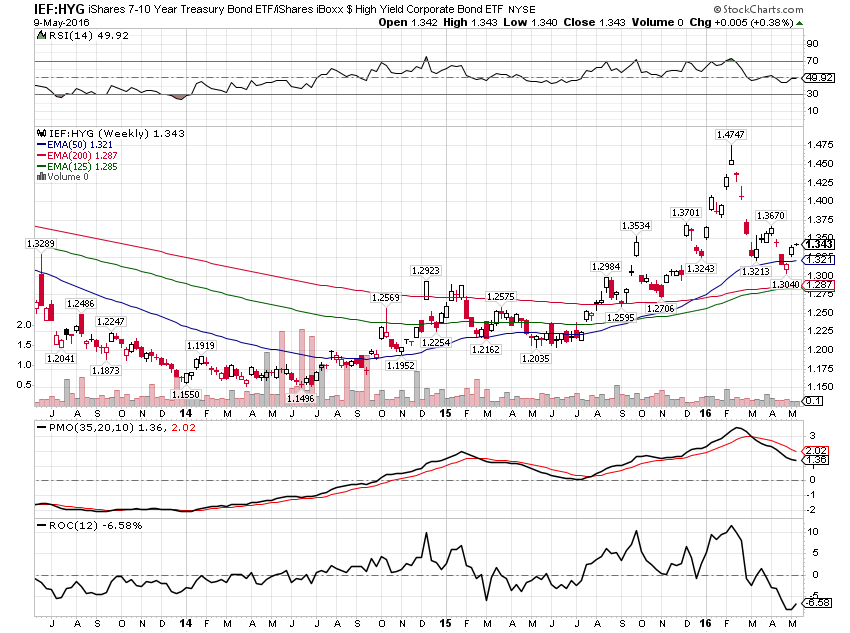
Here’s another way to look at this relationship that makes the trend a little clearer. This is a ratio chart of IEF (7-10 year Treasuries) vs HYG (Junk bonds). When the chart is rising, Treasuries are outperforming junk. That has been the trend since mid-2014 and it hasn’t changed. The recent movement is best described as a correction in an ongoing trend. That could still change but certainly from this one can’t draw that conclusion.
Treasuries versus Junk
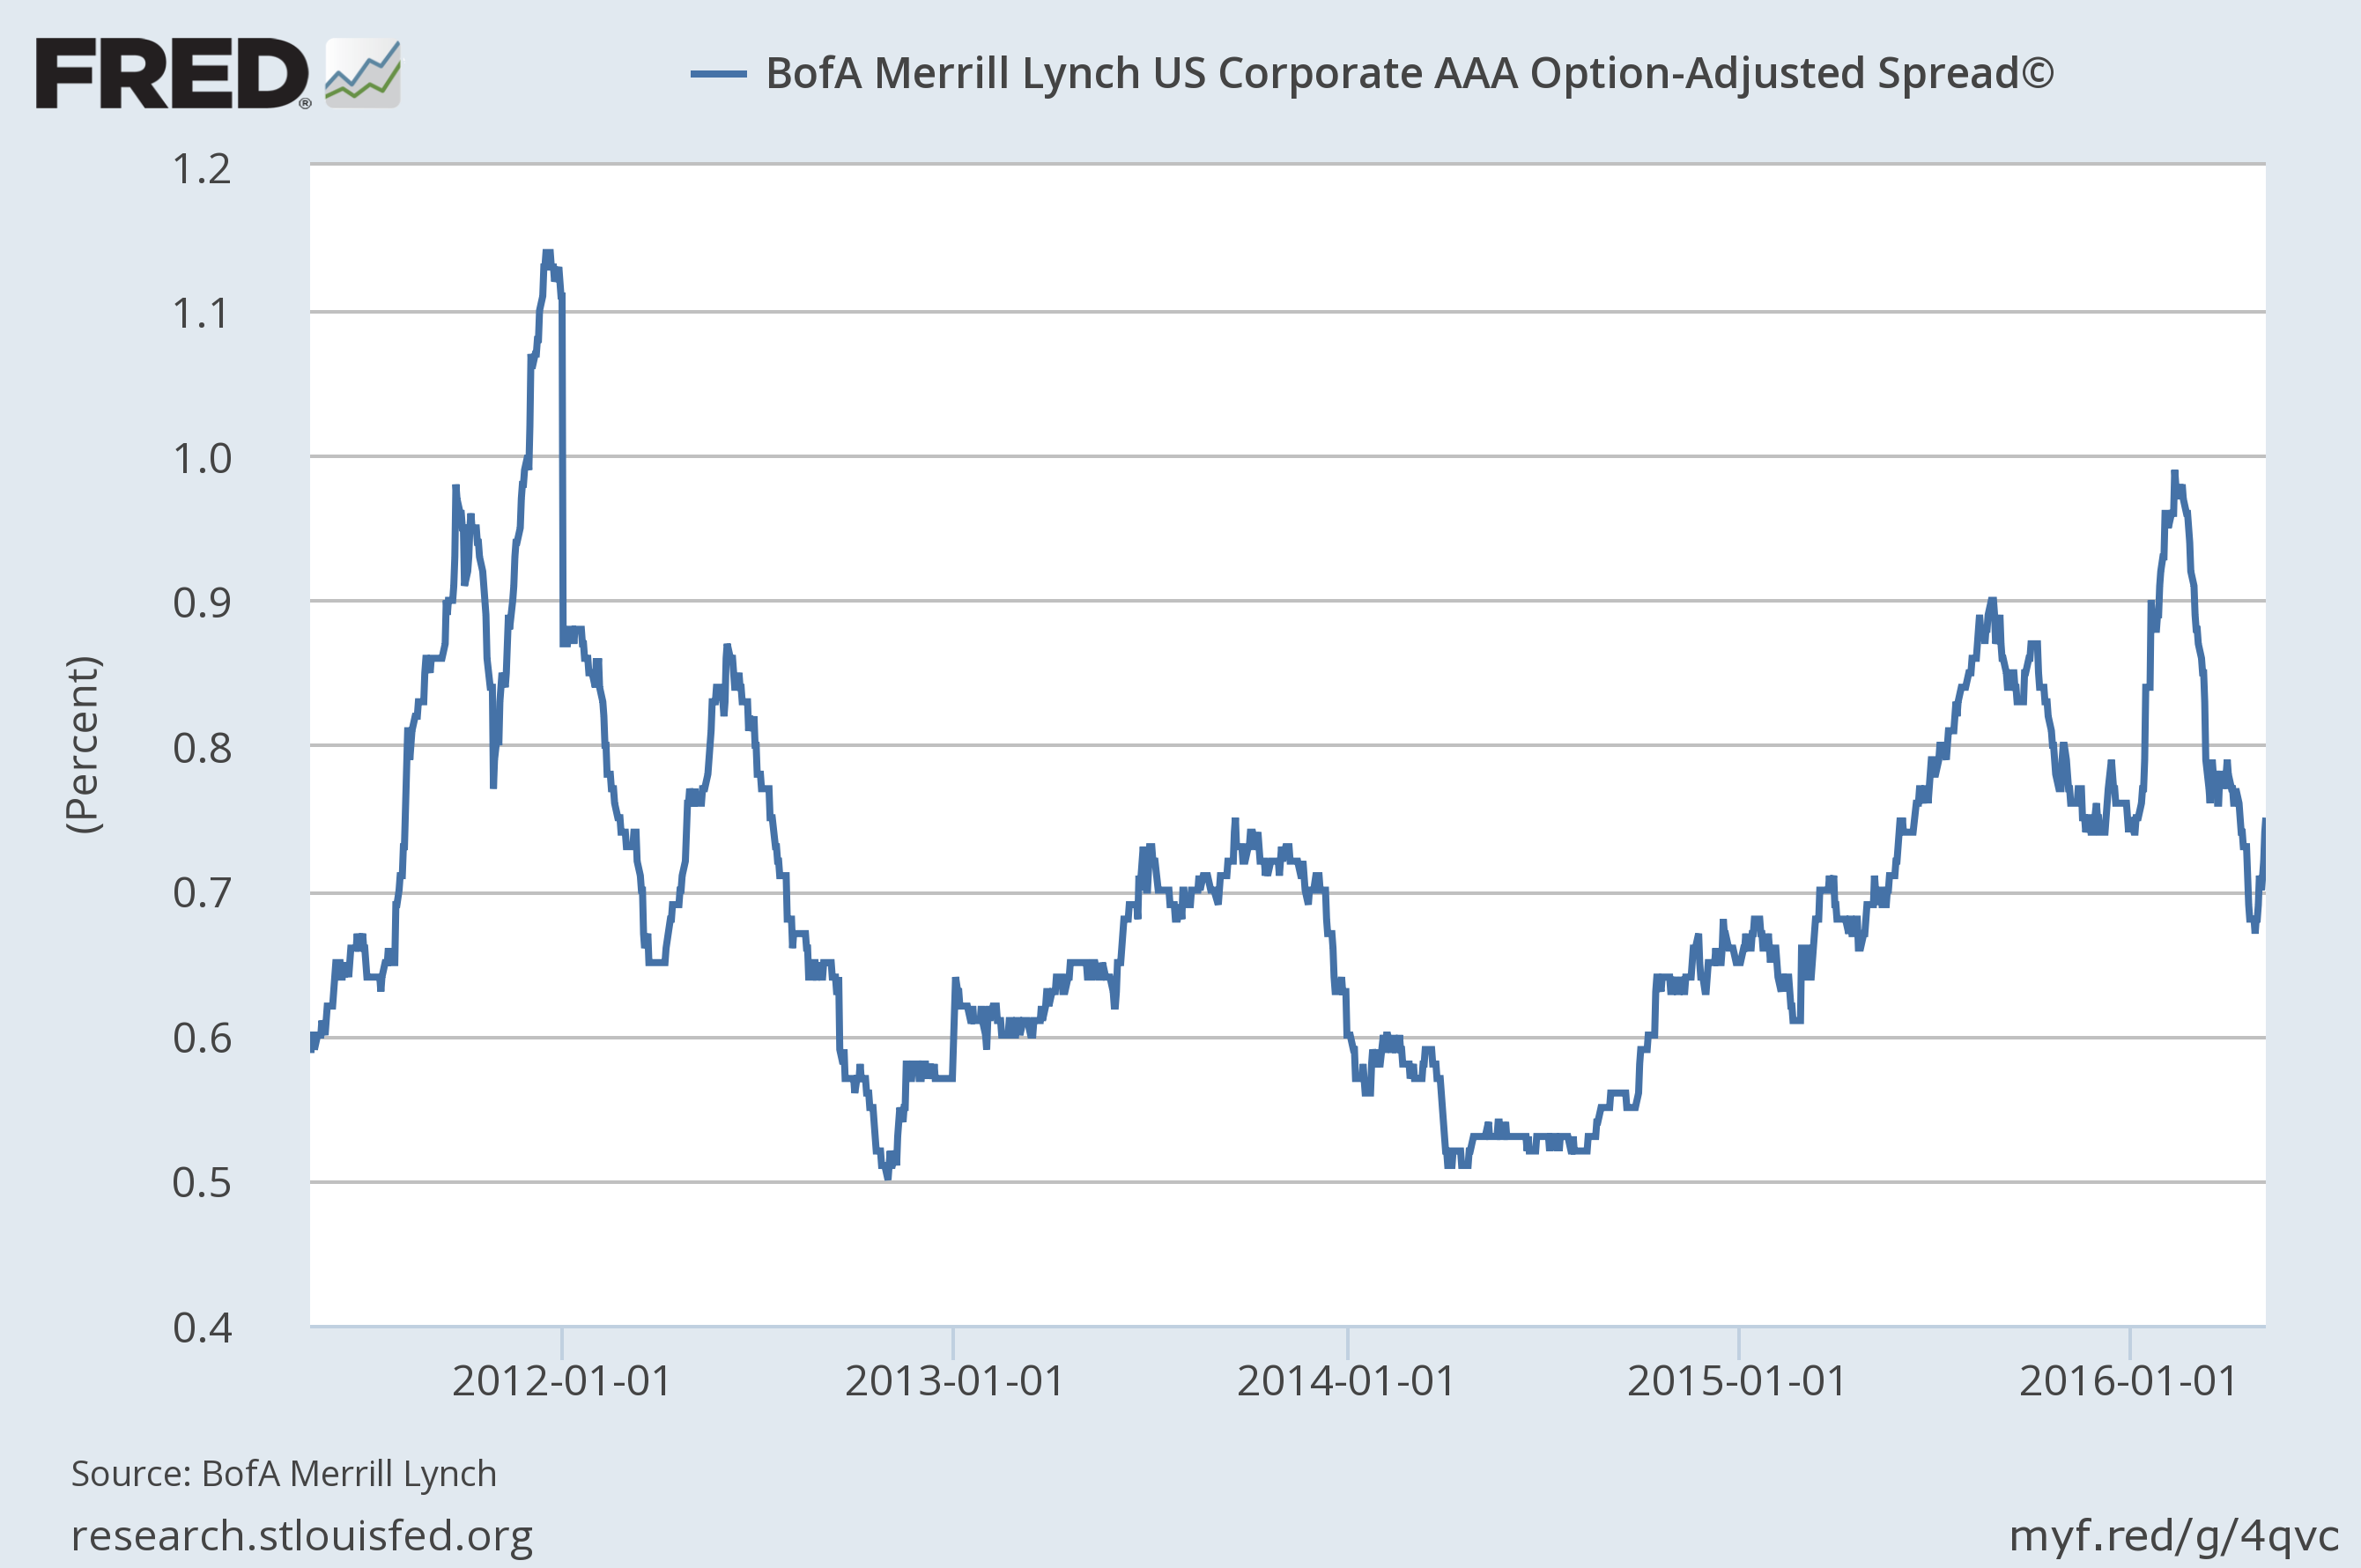
AAA spreads narrowed considerably over the last month but that’s because there are only two left after Exxon Mobil (NYSE:XOM) lost its AAA rating that it has had since the Depression. What is actually more interesting is the little tick wider over the last couple of weeks. Spreads on JNJ and MSFT are moving wider? Well that certainly doesn’t seem good/
AAA Spreads improved as Exxon Mobil lost its AAA rating
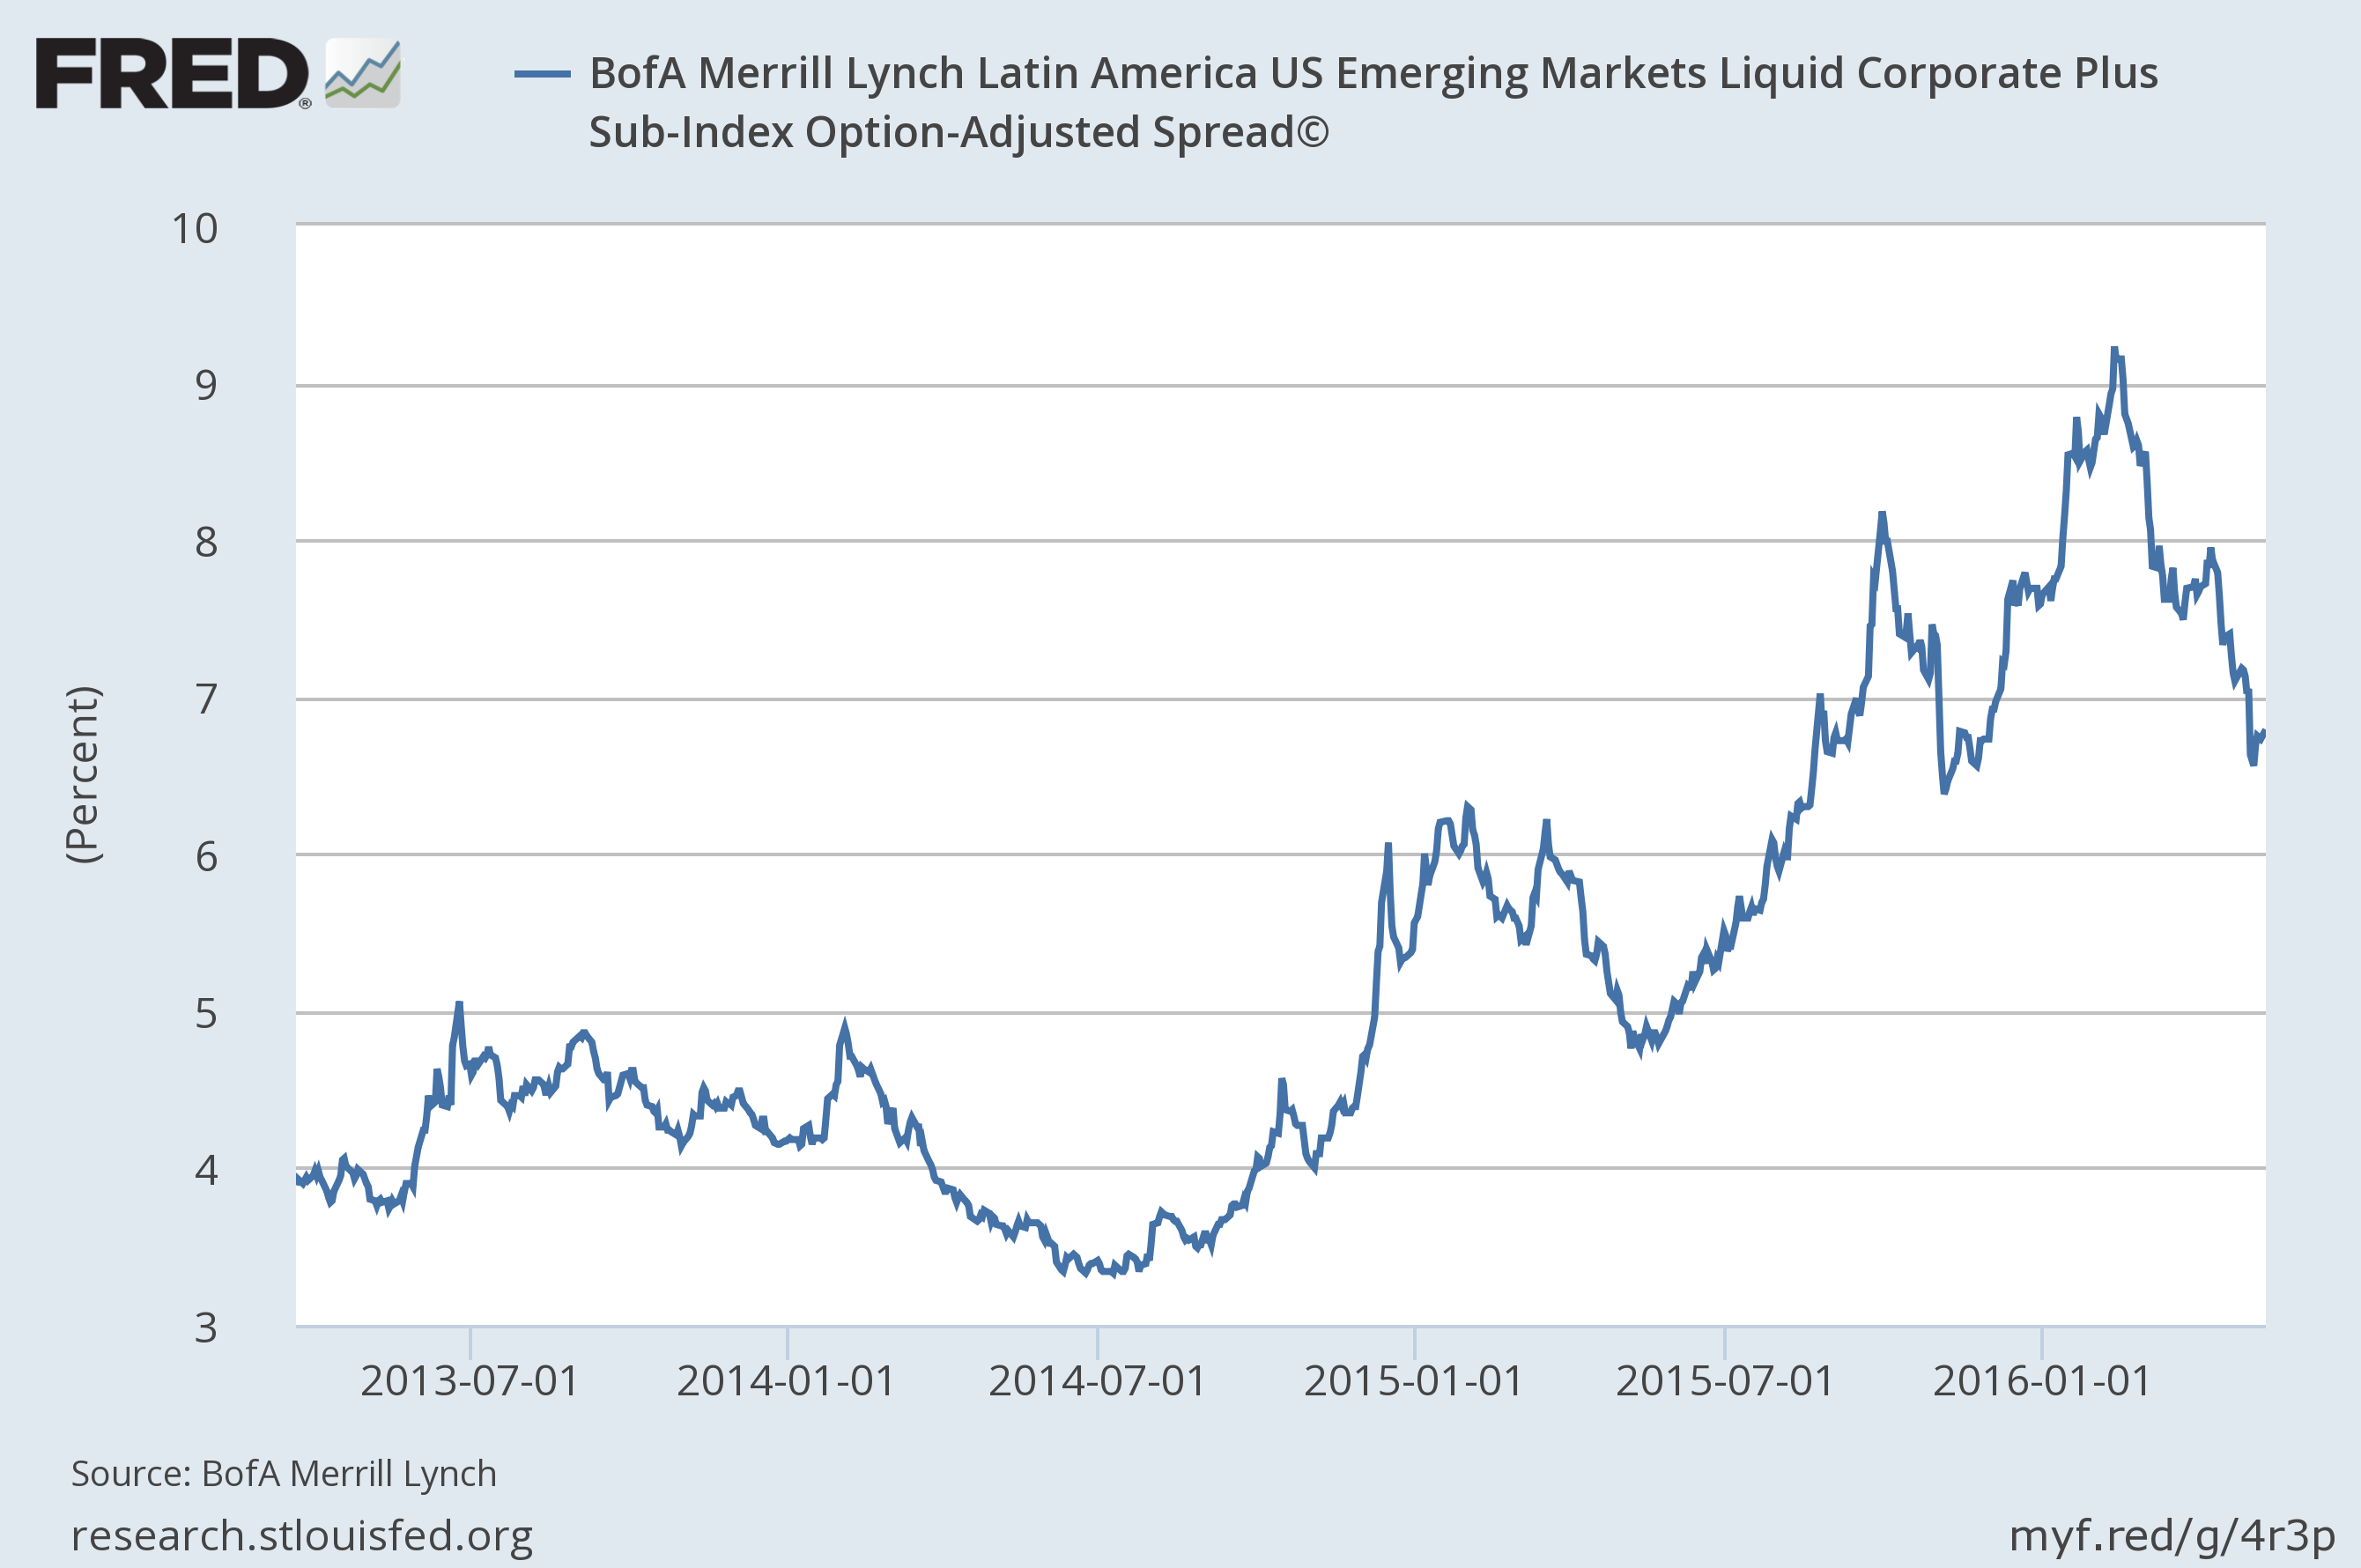
Latin American spreads continued to narrow since the last update too and they do appear to have broken their widening trend. Will it be sustained? Unknown but probably dependent on a couple of factors. First is obviously commodity prices and that means the dollar. As I said above, I don’t think the dollar index has broken down sufficiently to get aggressive with weak dollar investments just yet. It is close but no cigar. Second is the political situation in Brazil which no one can predict.
Is Latin America all better again?
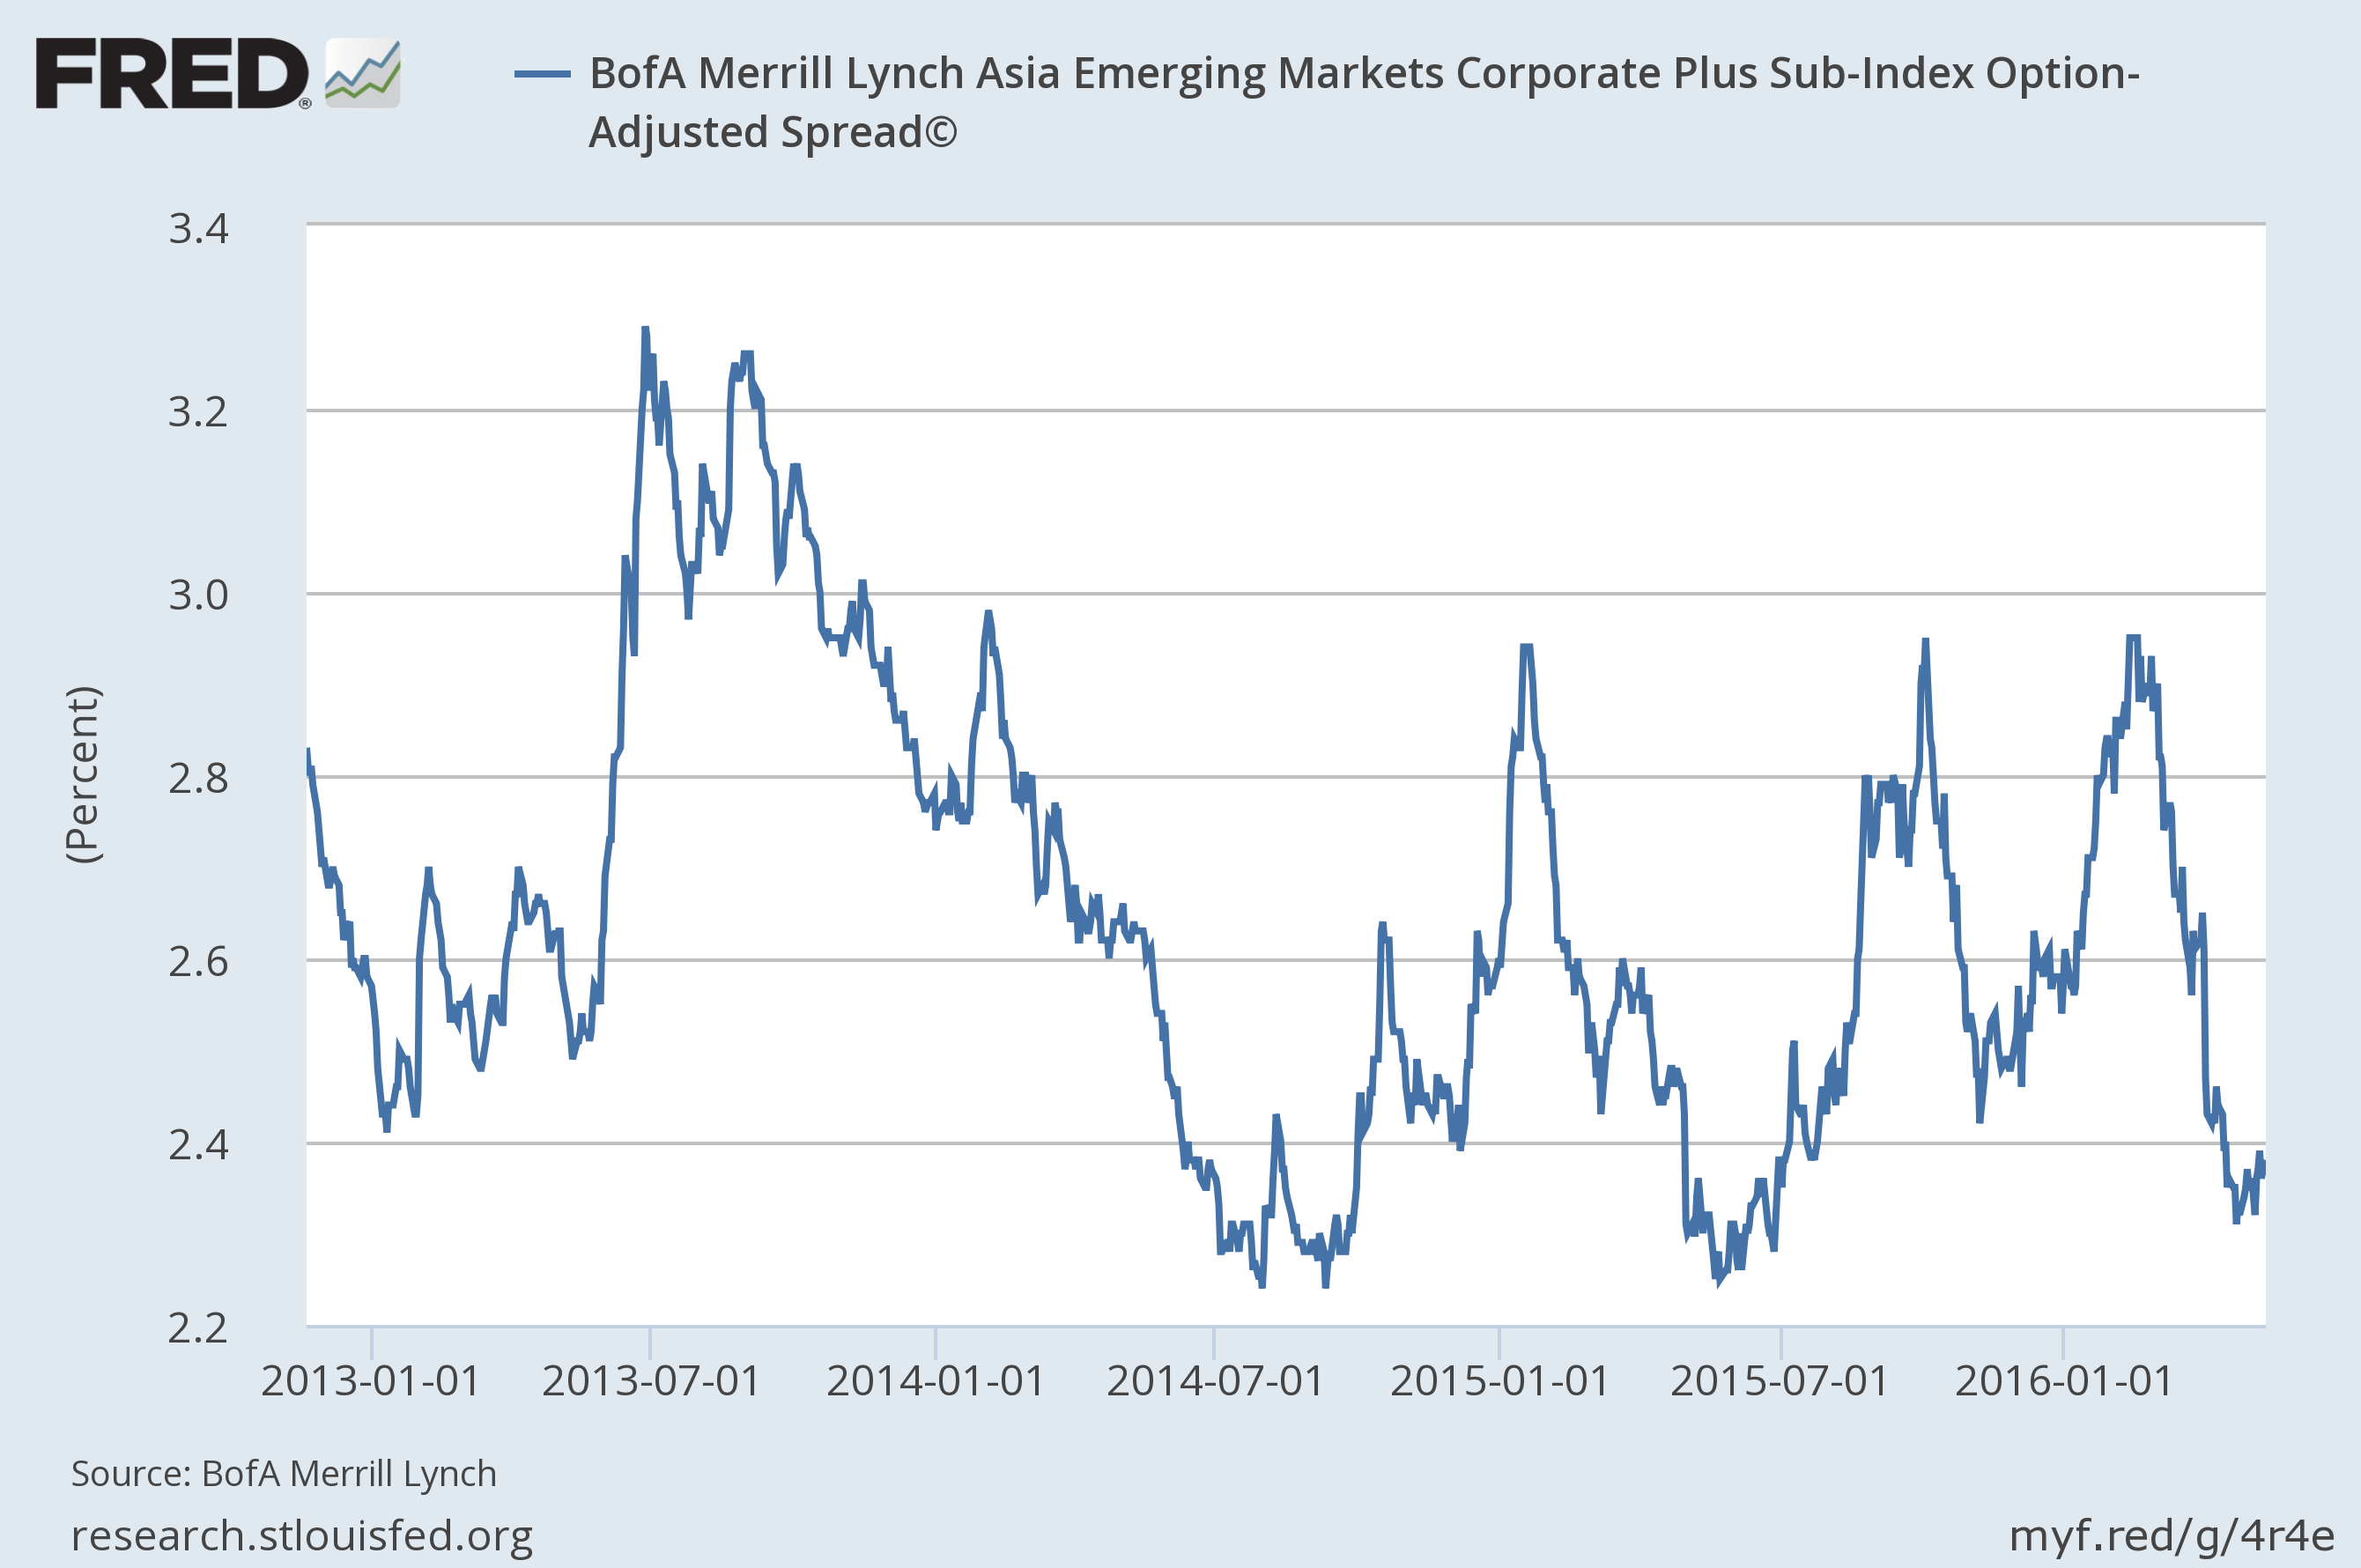
Asian spreads are near their lows, the widening episode seemingly over. However, there does seem to be a developing pattern and a move up from here would not be surprising in the least. That would probably coincide with a rise in the dollar. The concerns in Asia were driven by dollar strength and its effect on China and other dollar debtors in the region.
Asia stress is minimal
Credit spreads widened primarily as a function of US dollar strength. Falling oil prices threatened the shale industry here in the US and the impact was felt in the junk bond market (and in financial institutions with exposure to oil loans). More generally, falling commodity prices affected emerging markets along with Australia, Canada and a few other developed countries. Spreads widened in Asia due to fears about dollar denominated debts taken on when the dollar was weak. Now that the dollar has fallen those pressures are easing and credit spreads are narrowing.
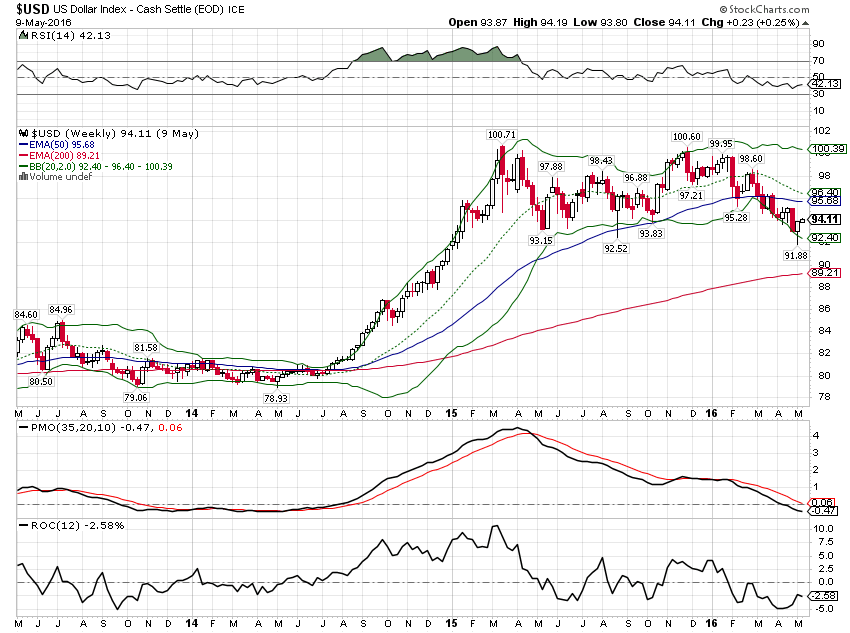
But is the dollar really weak and destined to get weaker? The dollar is actually not that weak, only falling back to the bottom of the range that has existed since the beginning of last year.
The dollar is just back to the bottom of the range
As for its future value, that will be determined by the relative difference in growth expectations between the US and the rest of the world. Those expectations are generally represented by real interest rates. Capital will flow to those areas of the world with relatively high real rates, affecting exchange rates. I have my doubts about a revival of emerging market growth but capital is flowing back into those markets and it may be a self fulfilling prophecy. Does capital flow to emerging markets in anticipation of better growth? Or does the capital inflow create the growth? A bit of both probably but I’m going to need a bit more evidence that this is more than a dead cat bounce before I commit funds to EM bonds or stocks.
As for developed markets, Europe may be experiencing a bit of a cyclical rebound but their structural problems have not been solved and a stronger Euro won’t help. But for now, the perception seems to be that Europe is improving somewhat relative to the US. Japan is a different story and while growth prospects there don’t look particularly good, real interest rates have been rising relative to the US due to deflation. I believe negative interest rates themselves to be deflationary – a view I’ve held for a while and the rest of the world is coming to now – so unless the BOJ is about to hike rates, this probably isn’t changing soon. Research released just this week by the St. Louis Federal Reserve supports that view and private researchers have opined similarly. My simple supply/demand observation is that negative rates are a promise to destroy money and, absent a change in demand, are therefore positive for the value of the currency involved – deflationary. The research calls negative rates a tax but it amounts to much the same conclusion.
The point is that if real rates are the driver of exchange rates – a pretty standard view of things in currency markets – negative interest rates ironically make a country’s currency more attractive by making it more scarce, thereby creating the very thing they were trying to vanquish. The Europeans and Japanese central banks would appear to have taken careful aim at their currency war adversaries and shot themselves in their lower extremities.
So, for now, I’m content to wait and see if the narrowing trend is sustainable. If the dollar falls more, then the answer is probably yes. If the dollar stabilizes here, maybe. If the dollar rises, the answer is probably no.
Yield Curve/Bonds
The yield curve steepened ever so slightly since the last GAA update. That is primarily a function of the Fed’s reluctance to raise rates. We started the year with the market expecting a fairly normal pace of rate hikes. Then we downshifted to fewer rates hikes and now we’re questioning whether we’ll get any at all. From a yield curve point of view, fewer rate hikes means better growth and longer until the next recession. I’ll take the under on that one but most people take it as a positive so that’s how the market reacts.
Yield curve has steepened very slightly
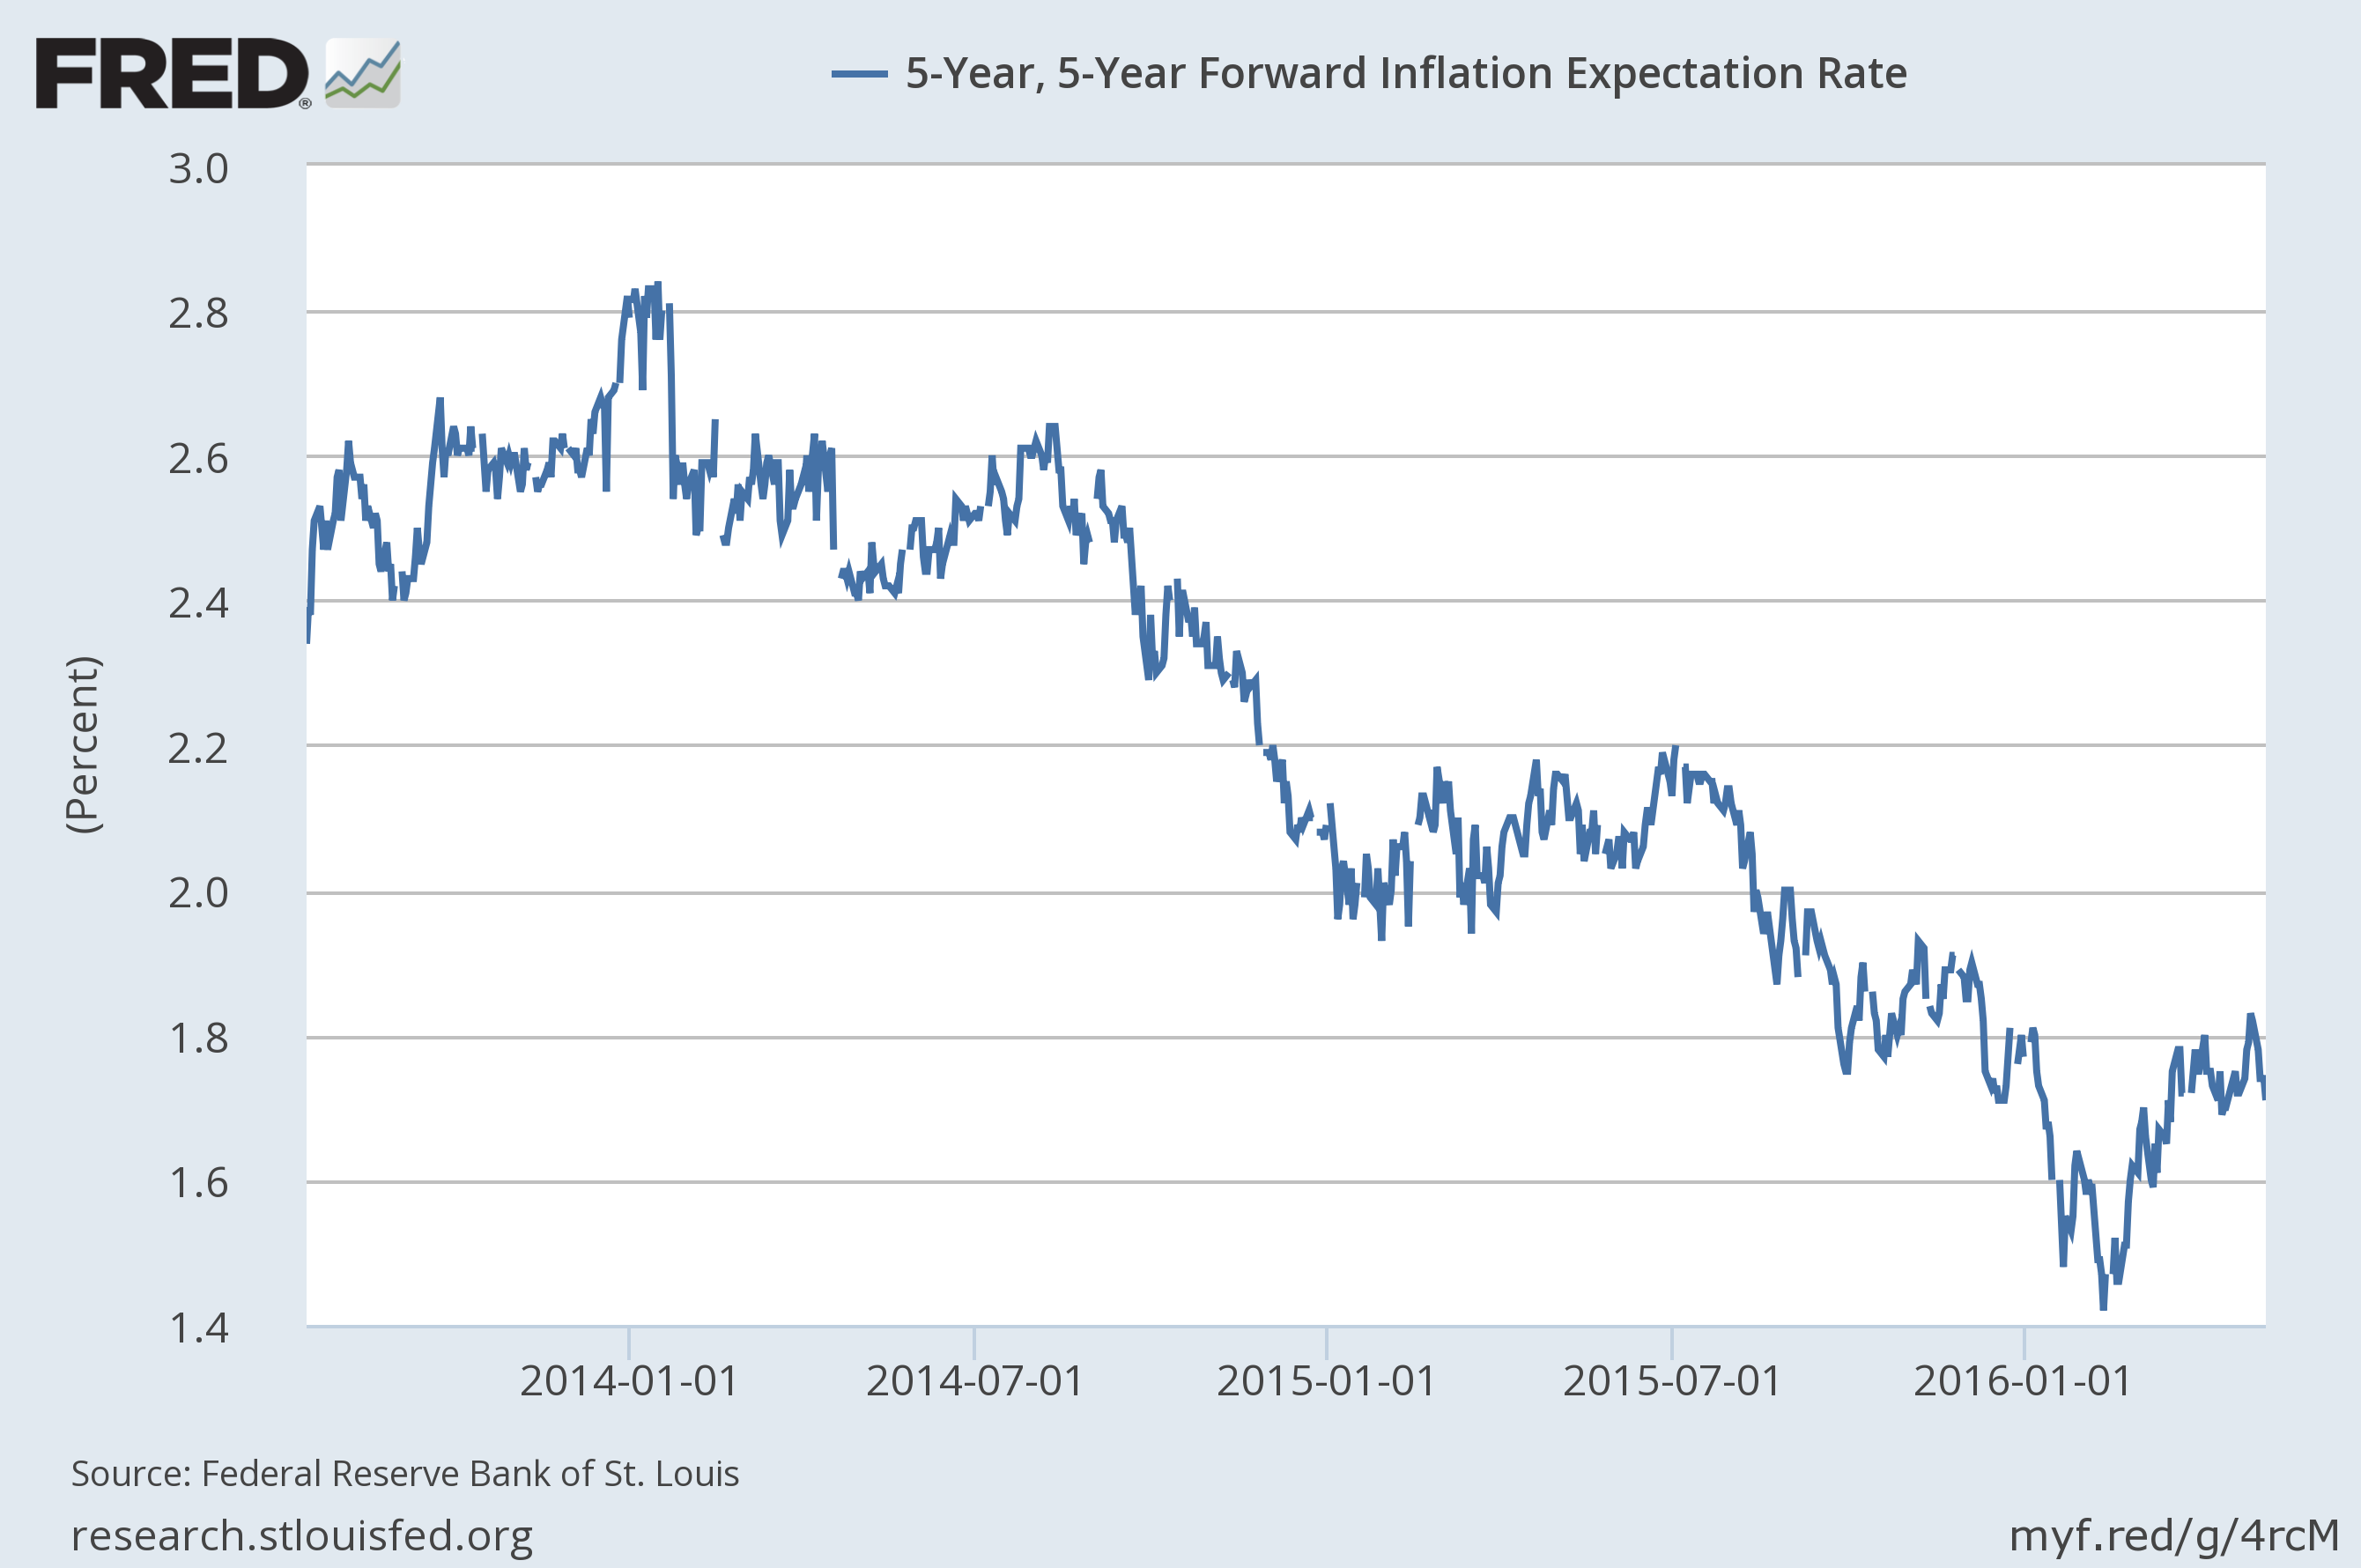
Inflation expectations continued to rise until about a week ago. It isn’t coincidence that inflation expectations stopped rising at the same time the dollar stopped falling. Despite all the nonsensical talk about wage inflation (rising minimum wages all over the place) the fact is that inflation is a currency phenomenon. All the measures of inflation – CPI, PPI, GDP deflator, etc. – are nothing more than poor attempts at measuring the value of the dollar, its purchasing power. Expect inflation expectations to start rising again if/when the dollar resumes its downtrend.
Inflation expectations were rising but peaked as the dollar bottomed
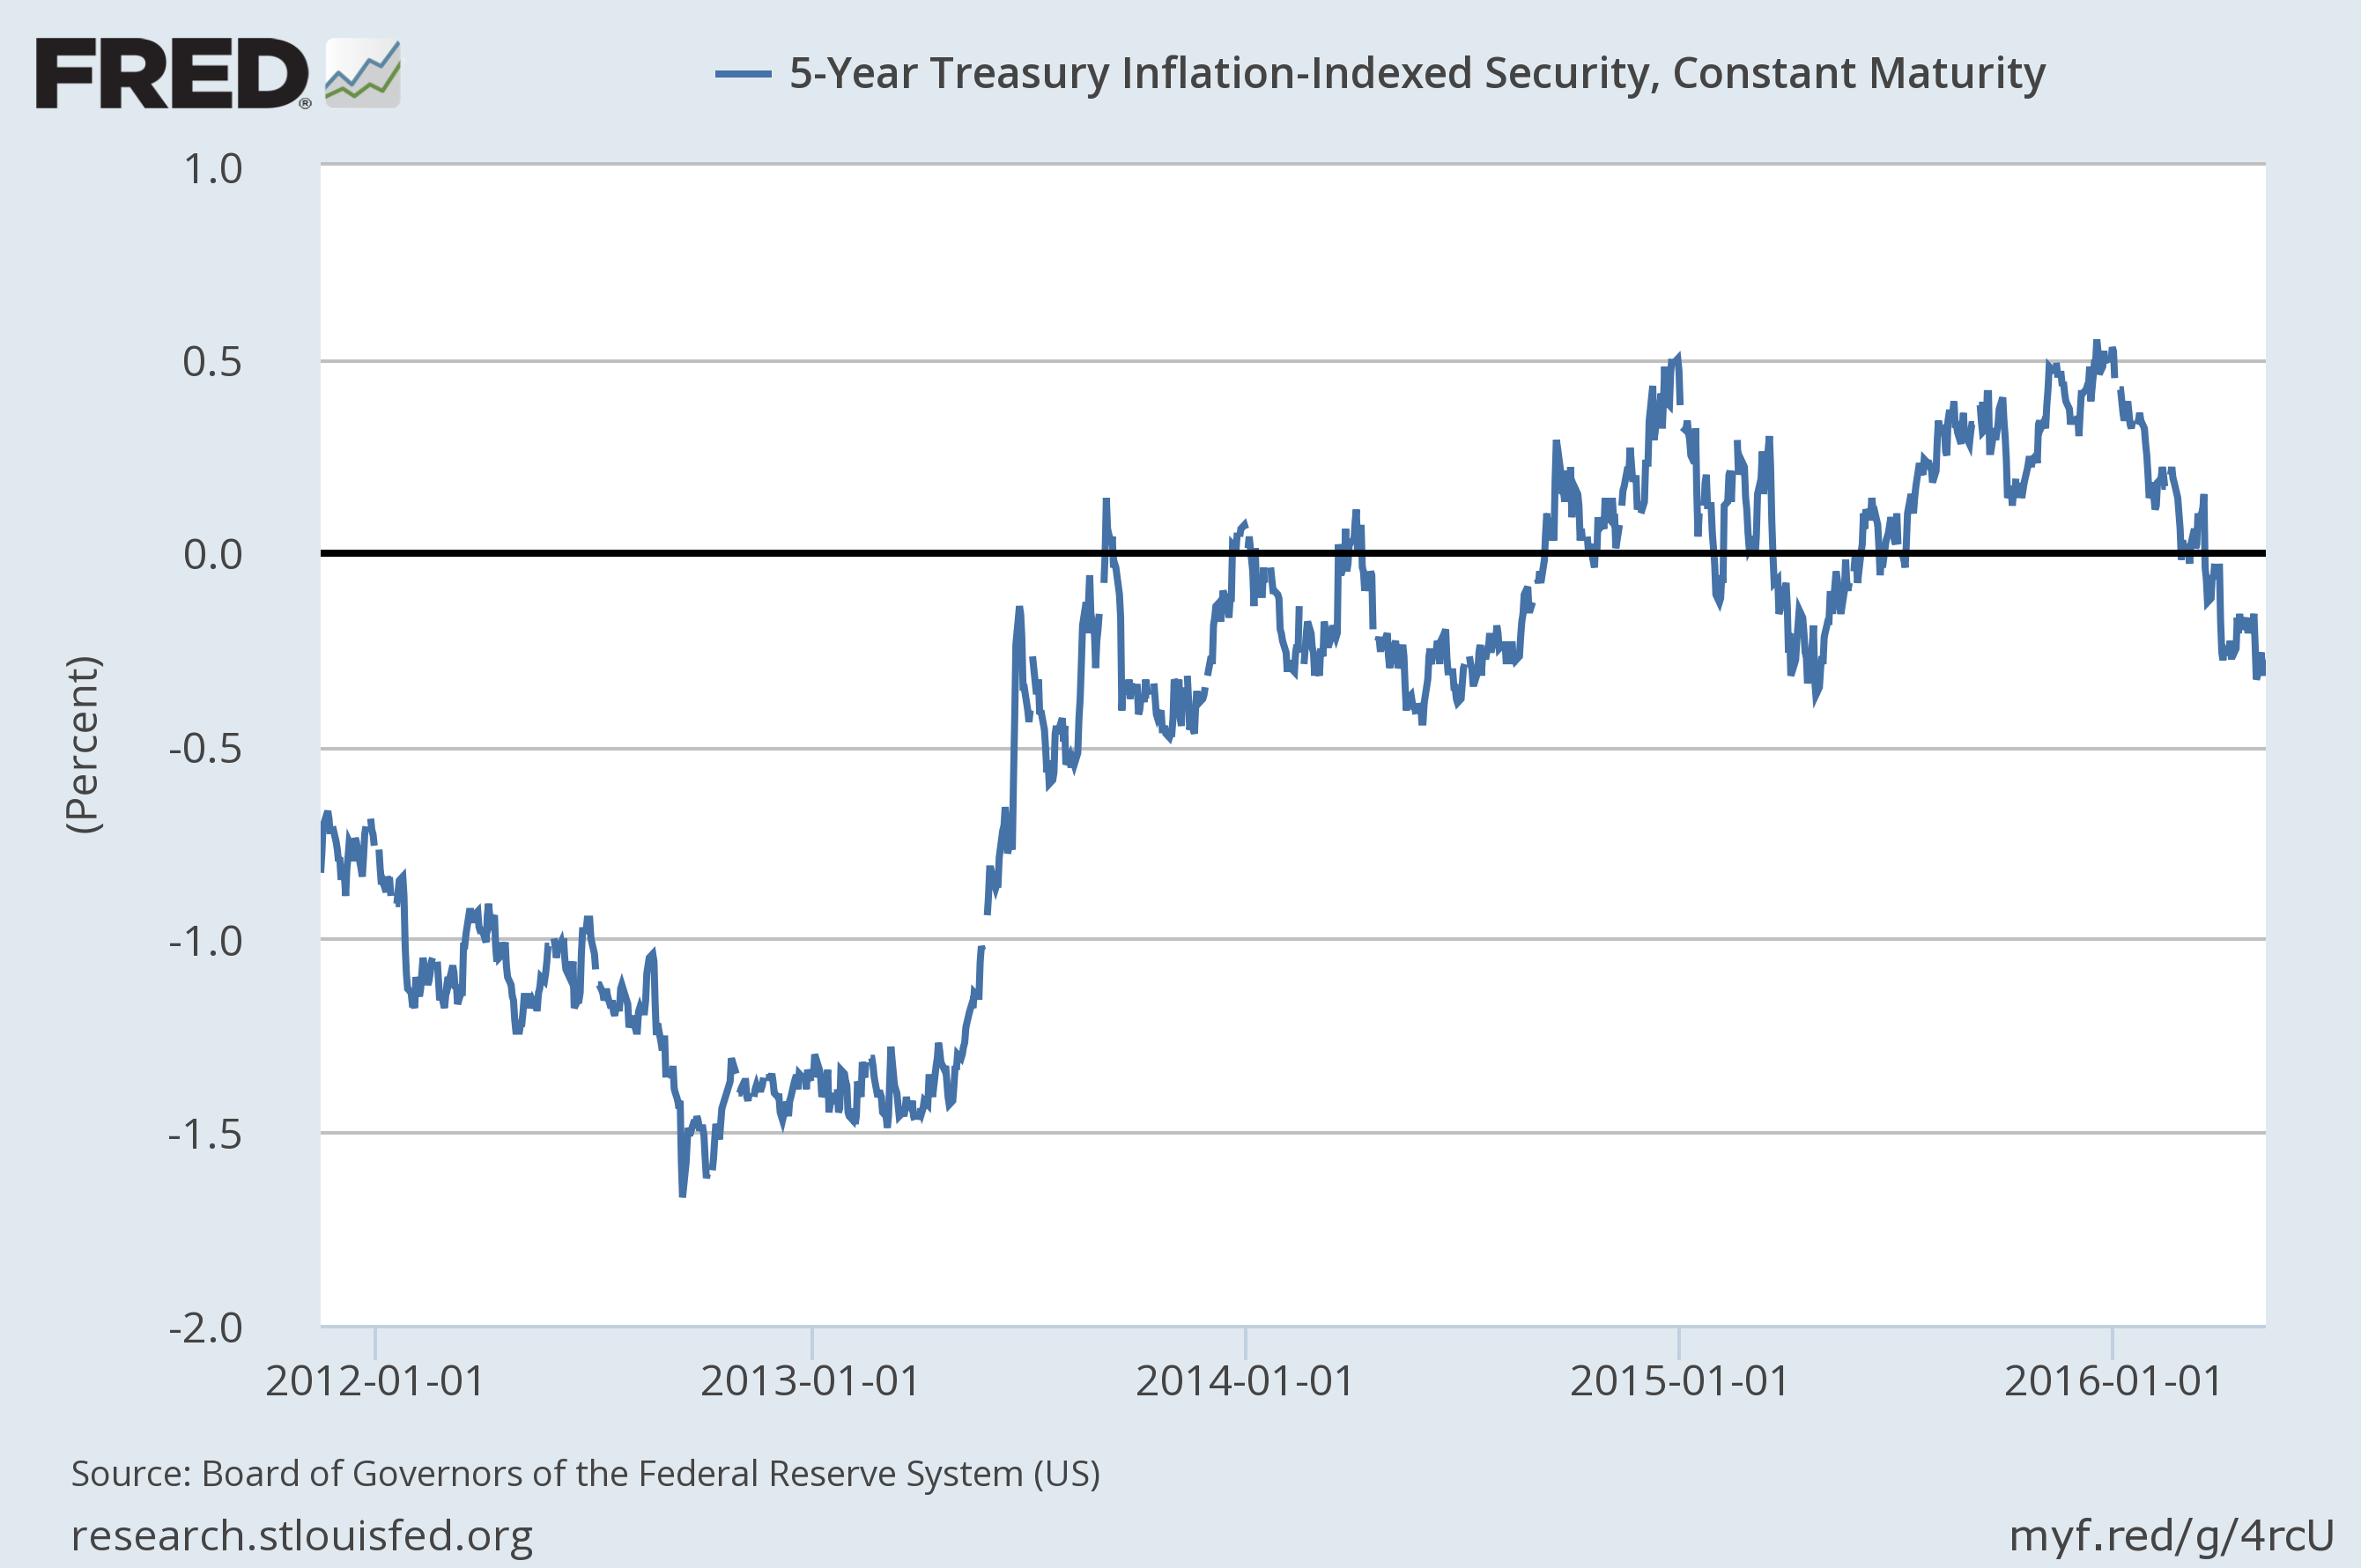
With TIPS yields still solidly negative, upside for the dollar is limited. Assuming real rates stay negative and the BOJ and ECB remain clueless about what is driving their currencies – likely but not assured – the dollar outlook remains negative.
TIPS yields – real yields – are still negative
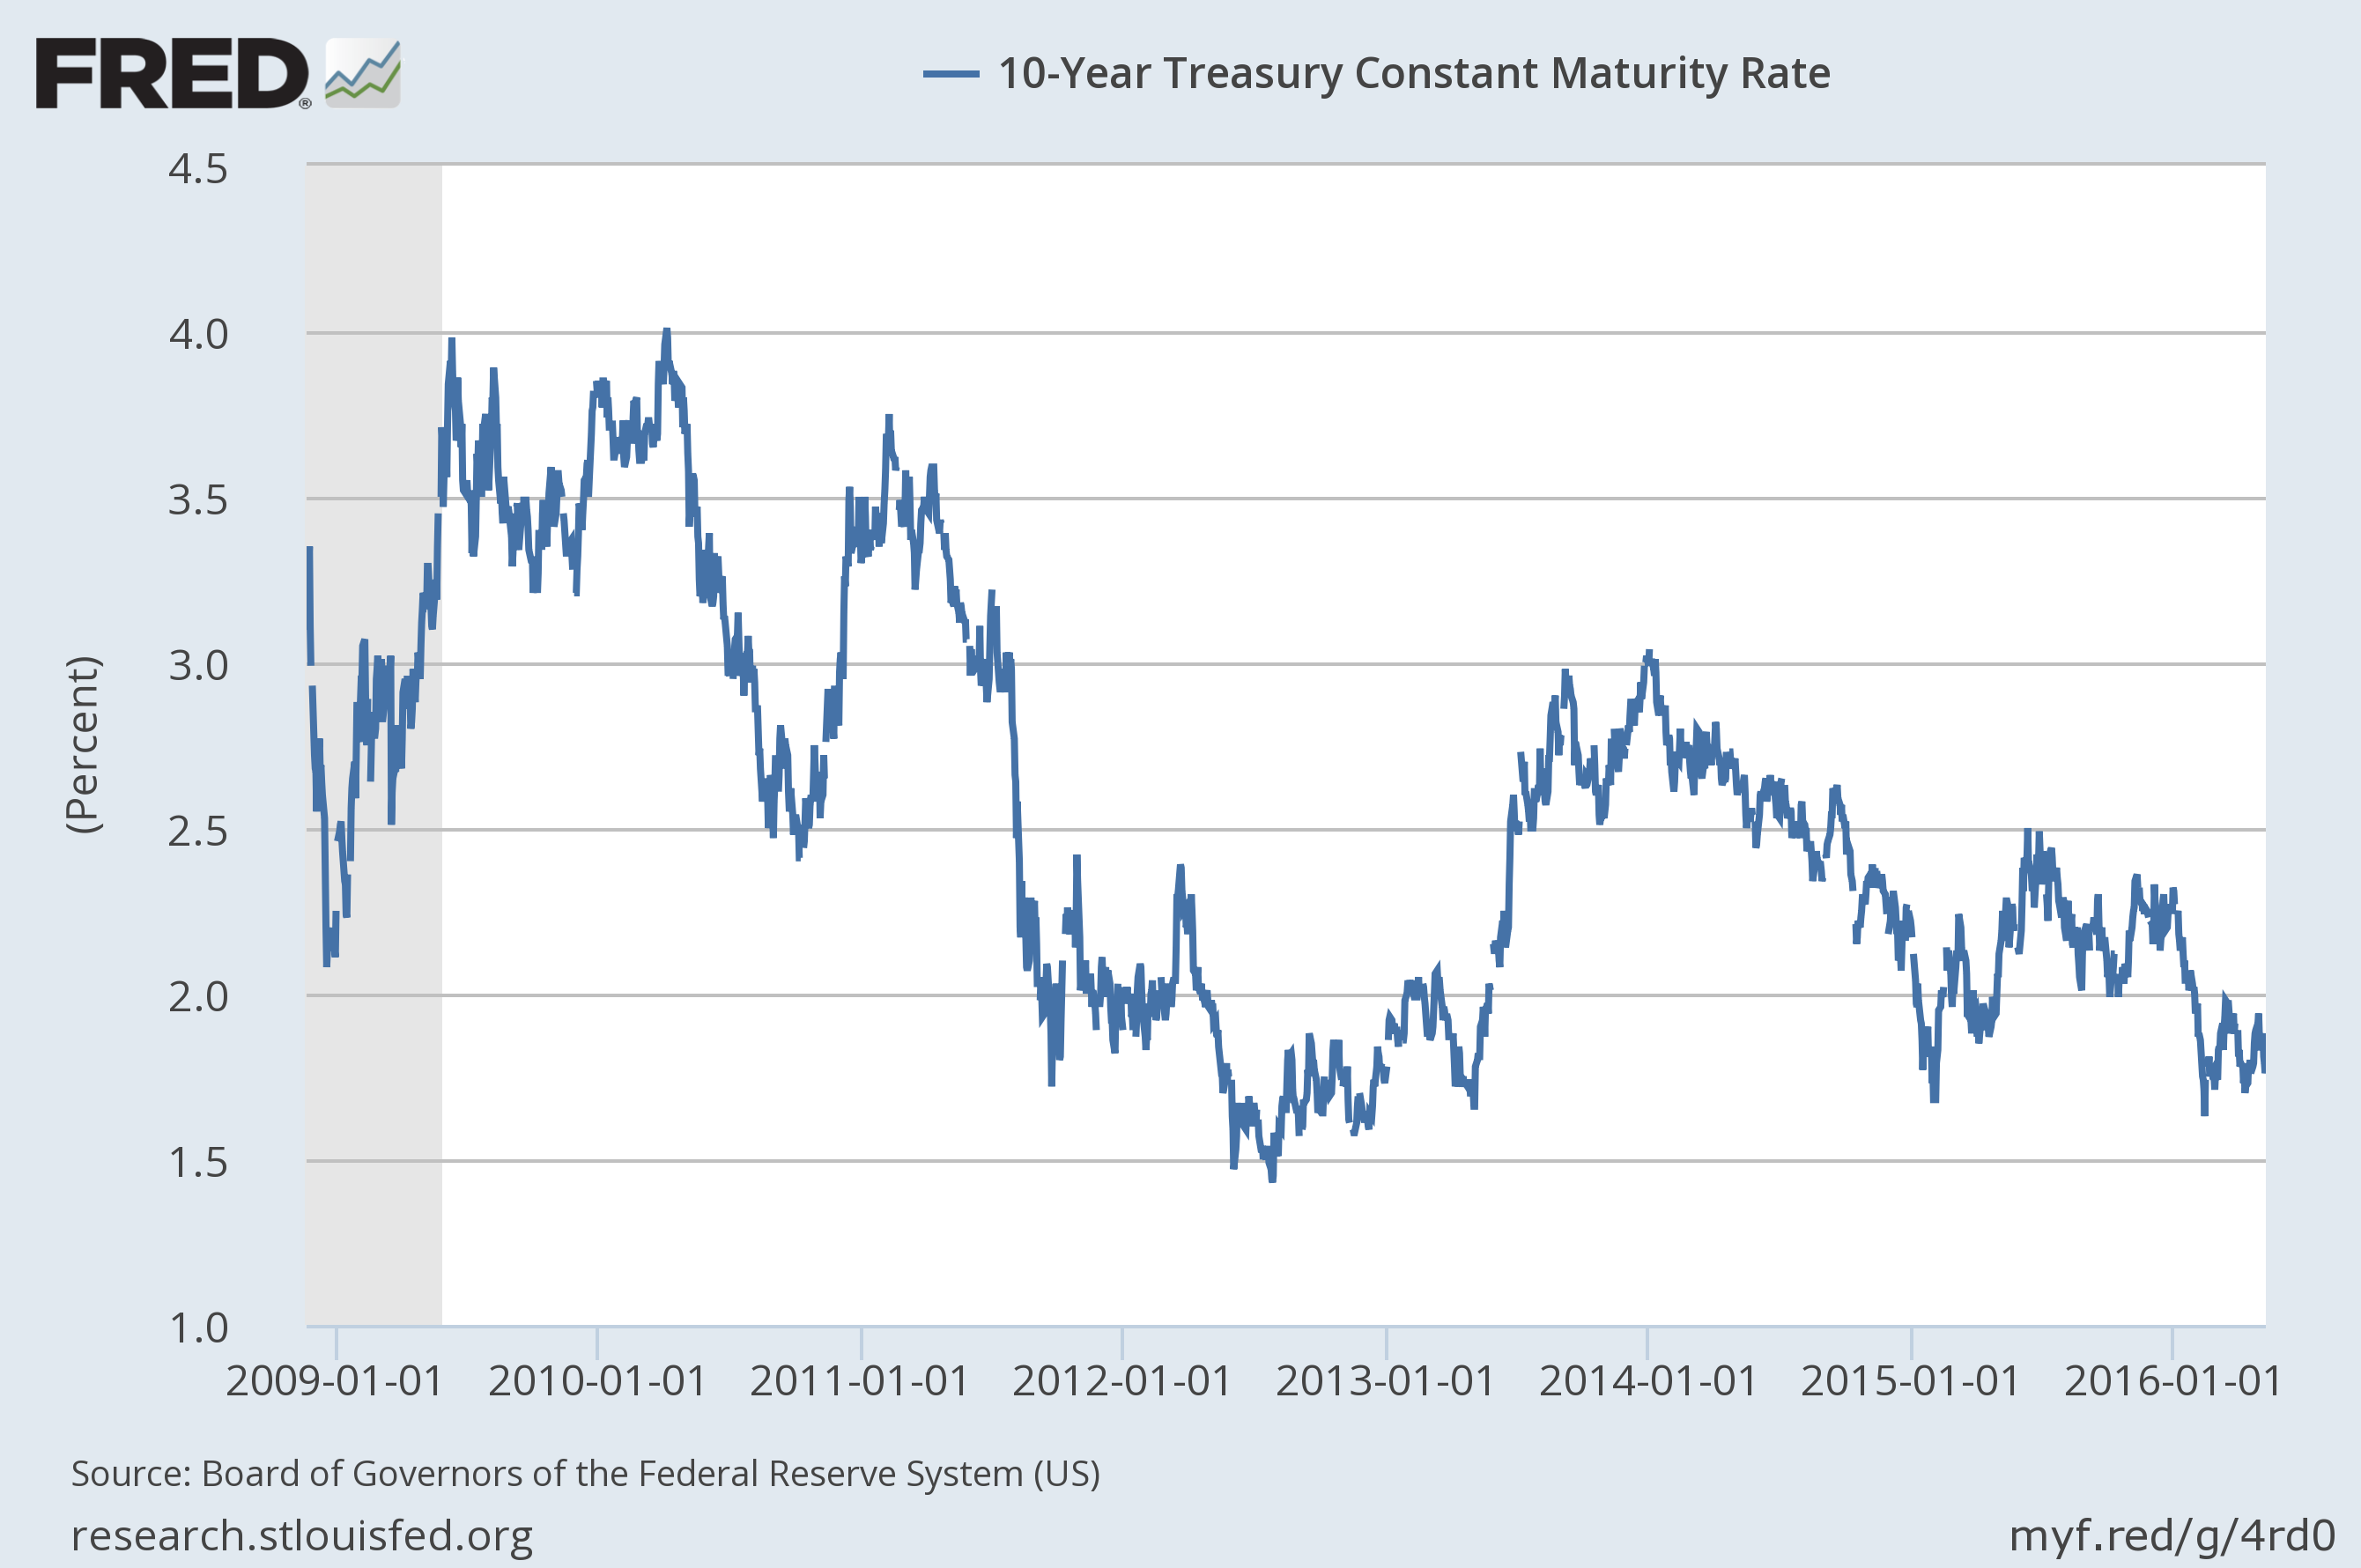
Nominal bond yields are also still trending down, a reflection of nominal growth expectations. Unless we see a rapid improvement in the economic data, I would expect to break the July 2012 low around 1.43% on the 10 year Treasury. If the economy continues to slow, the 10 year could easily see 1%.
Is the 10 Year Treasury yield headed for sub-1.5%?
Markets continue to tell a story of weak US growth and improving international growth, especially in emerging markets. Markets can of course be wrong but that’s their story and they’re sticking to it so far.
Valuations
With total market cap/GDP at around 120% in the US, stocks here are still very expensive. That is well above the long term mean (about 90%), way, way above the low (35%) and just a bit below the all time high (149%). That’s just one way of measuring things but all the other methods that provide useful information (trailing P/E and forward P/E are not in that category) show similarly high valuations. There are areas of the world with cheap markets but they all have problems – as cheap markets always do. As I’ve been saying for some time, emerging markets are outright cheap and the cheapest in the world. Developed international markets are a little less appealing but still a lot cheaper than the US. Cheap EM: China, Russia, Brazil, Singapore and India. Cheap DM: France, Italy, Spain, Canada, Australia, Netherlands. That is not an exhaustive list and it sure isn’t a recommendation.
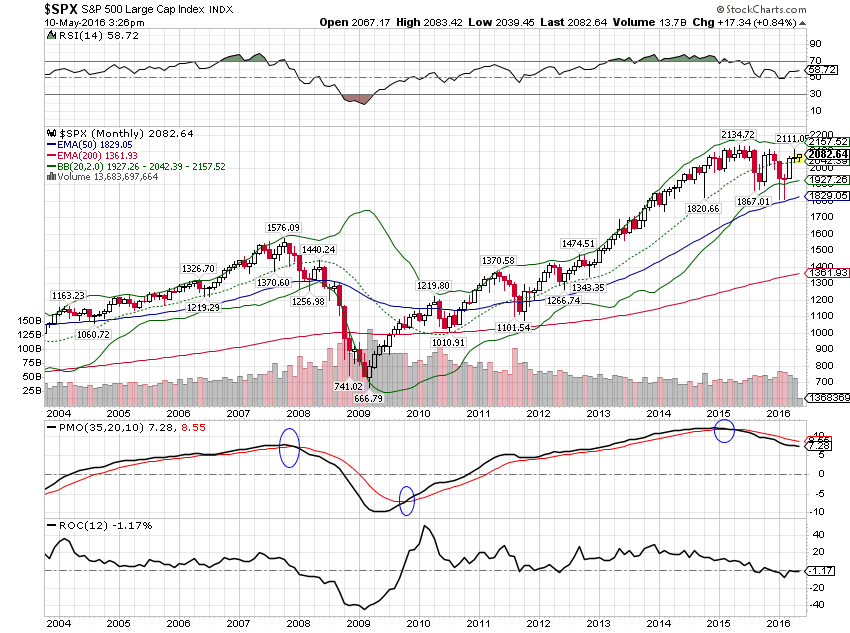
Momentum
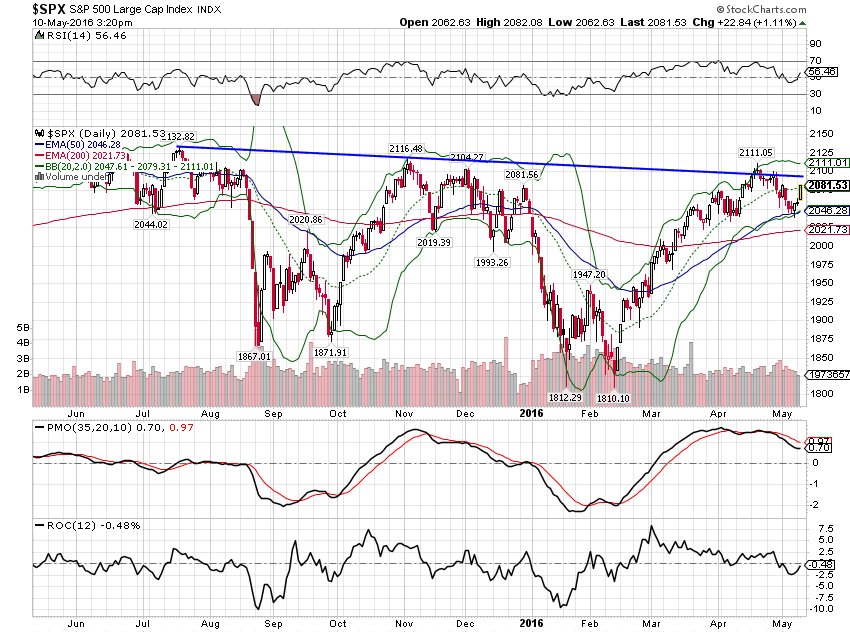
Short term momentum did roll over as I thought last month but there has been little follow through to the downside. I continue to believe, based on long term momentum measures among other things, that we are putting in a major top for the S&P 500. But a top doesn’t mean an immediate bear market. There are numerous reasons to expect one at some point but that will probably – almost certainly – be when the next recession hits. And while there is a lot wrong with the US economy, we aren’t in recession yet. Some parts of the economy are and some parts of the economy look like they might be headed in that direction, but as a whole – not yet.
Short term momentum rolled over but no follow through yet
Long term momentum remains on a sell signal
Foreign stocks are cheaper than the US and there is a hint of a shift in momentum now too. It is tentative and way too early to get too excited but if you squint and add a little confirmation bias…..
iShares MSCI EAFE (NYSE:EFA) outperforming SPY (NYSE:SPY) short term

Emerging markets have been outperforming the US all year and that is still true but the trend took a big hit the last month.
iShares MSCI Emerging Markets (NYSE:EEM) outperformance faded over the last month as the dollar found a short term bottom

As I said above, the dollar is just at the bottom of its range and has not broken out to the downside yet. However, our momentum indicator is on a sell right now. This is a monthly signal though and would only be valid if it survives until June. We’ll see.
A potential long term sell signal on the dollar index

Momentum continues to favor SPDR Gold Shares (NYSE:GLD) and bonds over the S&P long term


REITs continue to outperform

Japan looks ready to resume its relative outperformance

A final observation; the general commodity index ETF, iShares S&P GSCI Commodity-Indexed (NYSE:GSG), is outperforming both the S&P and gold over the last month and two months respectively. Our momentum indicator has produced buy signals on the daily and weekly charts for GSG vs SPY. The monthly chart still needs a little more upside to trigger but my guess is that it is coming. I would also expect some kind of correction of the trend, short term, as the dollar bounces from support. This commodity rally looks to me like it has legs but that is dependent on the dollar. Ask yourself this question: What would make foreigners want to sell dollars in bulk? The answer that immediately comes to mind starts with a capital T.

I’m not making any changes to the portfolios this month. It is tempting to raise the allocation to risk assets but in the end there just doesn’t seem to be sufficient evidence to do so. In investing the right answer to the question of what one should do is, more often than not, nothing. Here’s the moderate allocation as it was last month.
