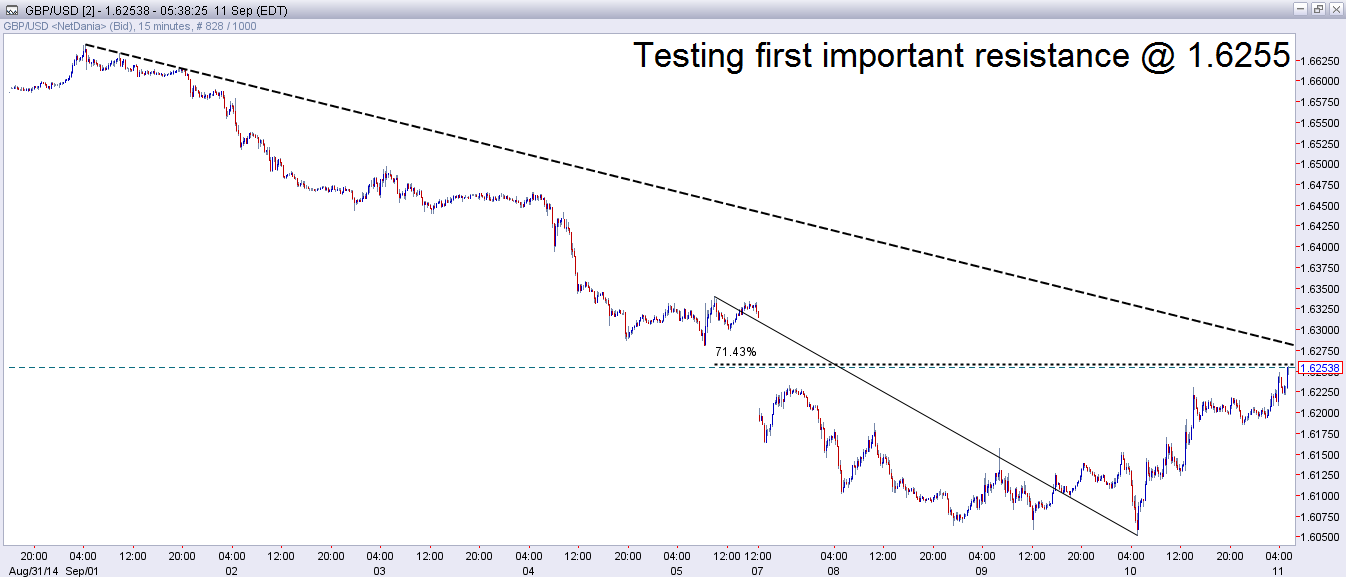
The pound bounced from 1.6050 yesterday in a very exciting manner, reaching 1.6263 so far (this is the current daily high at the time of preparing this report). This rising move has already challenged what yesterday’s report called the most important short term resistance, 1.6255. However, 8 pips are not enough to say that such a very important level is actually broken. Yes, this may turn out to be a break, but it can also be an accurate test which will be followed by the long awaited move towards 1.6005.
The reason why 1.6255 is the most important resistance for now is that it combines the micro term Marji 71.4% retracement, with the falling trend line from September 1st high. In fact, the trend line is still a bit above the Marji level, and this is why we need to be flexible about seeing a few pips above 1.6255. The actual trend line is currently running very close to another retracement level at 1.6276, and only with a break above this level that breaking 1.6255 would be confirmed.
If this actually happens, the gap will be expected to be filled, which means that the price will be expected to trade above 1.6327. The notable targets above Friday’s close include 1.6346, and 1.6388 ahead of 2 important resistance levels at 1.6416 & 1.6473.
On the other hand, any daily high between 1.6255 & 1.6276 could be followed with a significant falling move. The first sing that this falling move is becoming a real possibility would be breaking below the rising trend line from yesterday’s low, which is currently running at 1.6230. A break below this level will target micro term retracements at 1.6182, 1.6157, 1.6131 & 1.6111 ahead of yesterday’s 10-month low 1.6050, but the real target for such a move would be to accurately test, the key long term Fibonacci level at 1.6001!
Attached Chart(s):

Support:
• 1.6230: the rising trend line from yesterday's 10-month low.
• 1.6182: micro term Fibonacci 38.2% retracement calculated for the recovery from yesterday's 10-month low 1.6050 to today's current daily high 1.6263.
• 1.6157: micro term Fibonacci 50% retracement calculated for the recovery from yesterday's 10-month low 1.6050 to today's current daily high 1.6263.
• 1.6131: micro term Fibonacci 61.8% retracement calculated for the recovery from yesterday's 10-month low 1.6050 to today's current daily high 1.6263.
• 1.6111: micro term Marji 71.4% retracement calculated for the recovery from yesterday's 10-month low 1.6050 to today's current daily high 1.6263.
• 1.6050: yesterday's 10-month low.
• 1.6001: long term Fibonacci 50% calculated for whole enormous move from 2013 yearly low 1.4812 to July’s 6-year high 1.7190.
• 1.5954: September 23rd 2013 daily low & short term bottom.
• 1.5902/21: a well-known support area which includes several daily lows from October & November 2013.
Resistance:
• 1.6255: micro term Marji 71.4% calculated for the move from Friday’s American session’s high 1.6337 to yesterday’s 10-month low 1.6050. This level was tested during the preperation of this report, when the price topped at a daily high 8 pips above it.
• 1.6276: short term Fibonacci 38.2% retracement level, calculated for the drop from September 1st daily high 1.6642 to yesterday’s 10-month low 1.6050.
• 1.6327: Friday’s close, the beginning point of the gap.
• 1.6346: short term Fibonacci 50% retracement level, calculated for the drop from September 1st daily high 1.6642 to yesterday’s 10-month low 1.6050.
• 1.6388: short term Marji 57.1% retracement level, calculated for the drop from September 1st daily high 1.6642 to yesterday’s 10-month low 1.6050.
• 1.6416: short term Fibonacci 61.8% retracement level, calculated for the drop from September 1st daily high 1.6642 to yesterday’s 10-month low 1.6050.
• 1.6473: short term Marji 71.4% retracement level, calculated for the drop from September 1st daily high 1.6642 to yesterday’s 10-month low 1.6050.
Trend:
• Short term: Down, as long as we are below 1.6276.
• Medium term: Down, as long as we are below 1.6473.
• Long term: Up, as long as we are above 1.5492.
Article originally appeared on MarjiFX.com
