EUR/USD
The EUR/USD started the day in the losing side, down to a fresh year low of 1.3332, with the usual suspects behind it weak European data, US improved one with a shrinking deficit, and stocks in red on risk aversion. US opening however saw local share markets shrugging off fears and erasing early losses, now closing a handful points up. But the dollar sunk big out of the bloom mid American afternoon, movement that started with USD/JPY dipping to 101.78, in what seems to have been a really fat finger: market rumors talk about 27,000 contracts being place instead of 27. Despite unconfirmed, dollar maintained its weak footing particularly against the EUR that enters Asian session trading at its daily high.
Technically, the hourly chart shows a strong upward momentum coming from technical readings, with price above its 20 SMA but below 100 one, and indicators still heading north. In the 4 hours chart, indicators bounce from oversold readings, while 20 SMA stands around 1.3400 offering immediate short term resistance. Considering the ECB will meet early European session, the pair will likely trade range bound ahead of it, not seen overcoming 1.3440 before the news.
Support: 1.3335 1.3295 1.3250
Resistance: 1.3400 1.3440 1.3475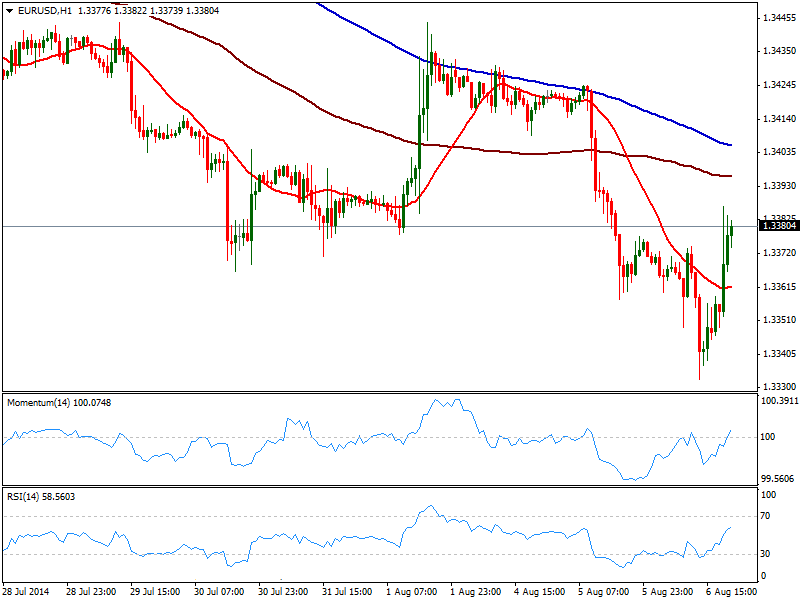
EUR/JPY
Yen wild intraday advance drove EUR/JPY to a fresh year low of 136.15, as the fat finger in yen contracts added to EUR self weakness. Slowly grinding higher, price consolidates below 136.60 strong static resistance level, with the hourly chat showing price well below 100 and 200 SMAs and momentum still heading lower despite in oversold levels. In the 4 hours chart indicators start getting exhausted in extreme oversold levels, but are far from suggesting an upward corrective movement. Above 136.60, the correction can extend near 137.00, but failure to advance beyond may see the pair resuming its slide after ECB.
Support: 136.60 136.20 135.80
Resistance: 136.90 137.50 137.90 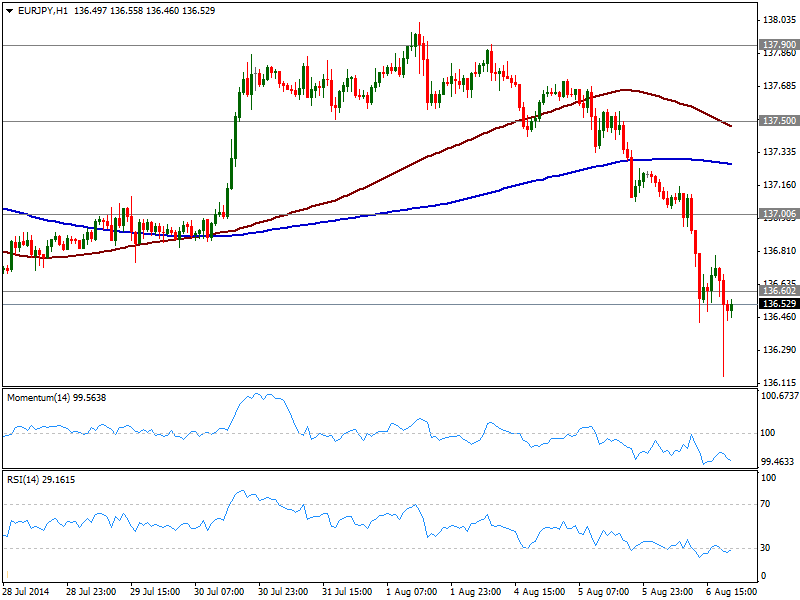
GBP/USD
The GBP/USD continues to be restricted to a tight range, lower as per weighted by another round of weak UK data, this time in the form of manufacturing and industrial production. The pair posted then a daily low of 1.6821, albeit managed to bounce some up to current levels. The hourly chart shows 20 SMA capping the upside a few pips above current price, with momentum heading higher still below its midline, but RSI turning lower also in negative territory, which keeps the short term risk to the downside. In the 4 hours chart technical readings stand flat in neutral territory, lacking clear direction as per having traded in range for already a week. Despite the BOE will meet on Thursday, expectations are of a no change there, and therefore to have little influence in Pound.
Support: 1.6800 1.6770 1.6730
Resistance: 1.6845 1.6895 1.6940 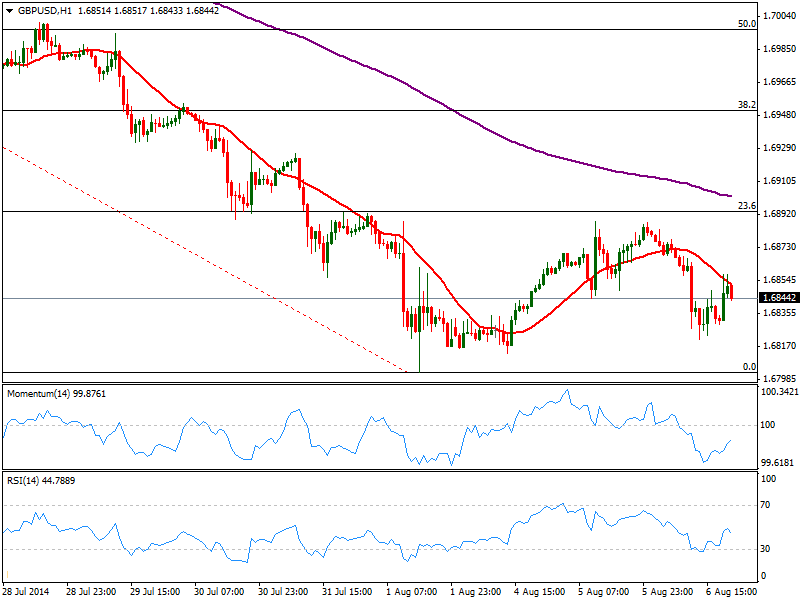
USD/JPY
The USD/JPY recovered right above 102.00 following a daily low of 101.78, and with the hourly chart showing 100 and 200 SMAs well above current price, while indicators attempt a recovery still deep in oversold levels. In the 4 hours chart a strong downward momentum prevails in indicators, and sellers may surge near 102.35 former support area. In that case, further slides, down to 101.60 are possible moreover on risk aversion, and despite dollar potential to advance.
Support: 101.95 101.60 101.20
Resistance: 102.35 102.80 103.10 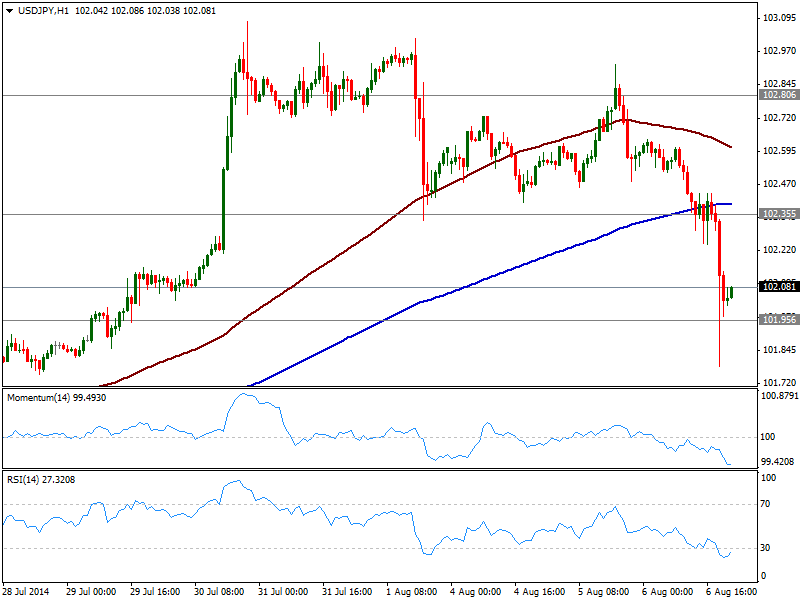
AUD/USD
Commodity currencies were on demand this Thursday, backed by soaring gold, with the AUD/USD up to 0.9330 strong static resistance. The sudden dollar drop drove the pair up to next strong resistance area of 0.9370, from where the pair eased some but held above critical 0.9330. Ahead of Australian employment figures, the pair presents a strong upward momentum in the short term, with price well above a bullish 20 SMA and indicators heading strongly up despite in overbought levels. In the 4 hours chart the technical picture is also bullish, looking for a break above mentioned 0.9370 for an upward rally towards 0.9420, and bulls losing ground on a break below 0.9330.
Support: 0.9330 0.9300 0.9260
Resistance: 0.9370 0.9420 0.9460 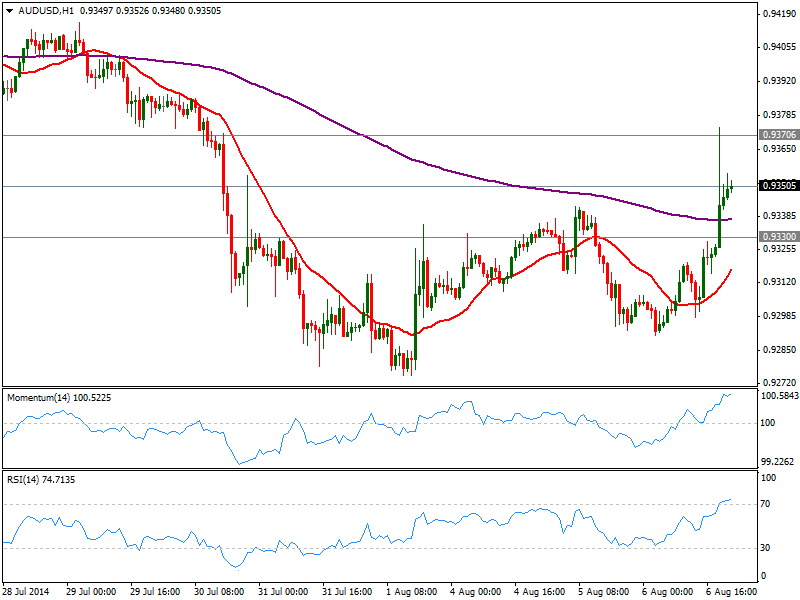
AUD/NZD
It was another positive day for AUD/NZD, with the pair completing a full 100% retracement and even extending a couple pips above July high and therefore establishing a fresh one for the year at 1.1052. Short term, indicators diverge from price action as despite there are higher highs on the chart, momentum head lower now resting around its midline; price hovers around its 20 SMA, which suggest some possible downward correction, not yet confirmed. In the 4 hours chart however, 20 SMA maintains a healthy bullish slope around 1.0975 acting as immediate short term support, while momentum aims slightly higher after some consolidation in positive territory. Australian employment figures could rock the pair during Asian hours, and as higher the divergence with expectations, the stronger the move could be. Anyway, some upward acceleration beyond mentioned high exposes the pair to a rally towards 1.1115, November 2013 monthly low, while 1.0940 should be the line in the sand for current upward trend.
Support: 1.1000 1.0975 1.0940
Resistance: 1.1050 1.1090 1.1115 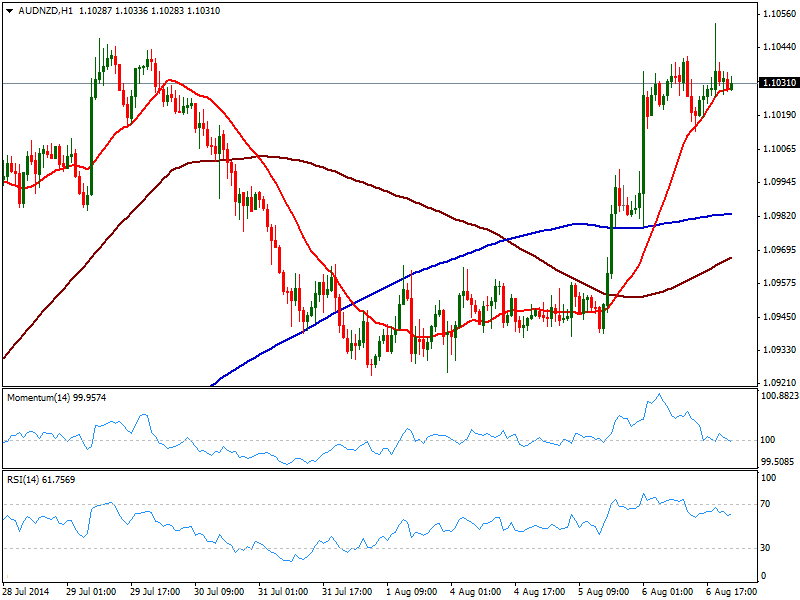
XAU/USD
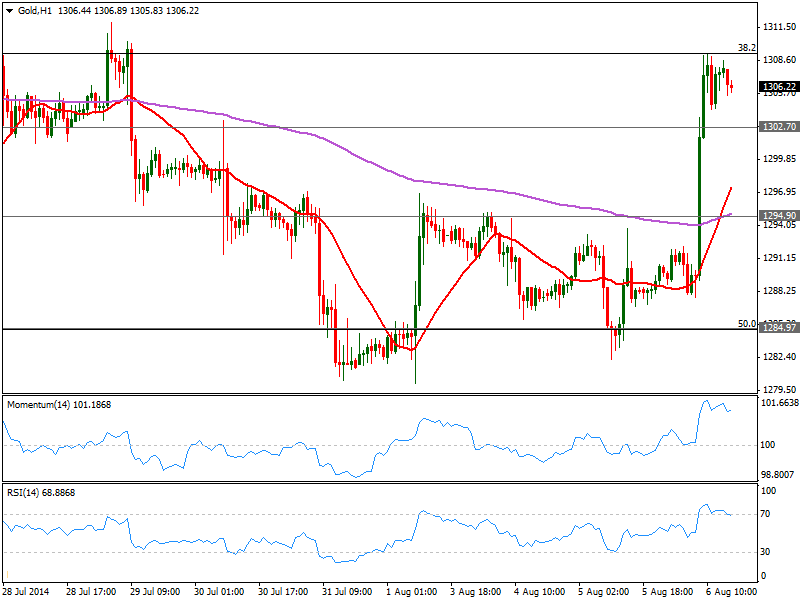
Risk aversion took its toll on gold that soared over 20 bucks early US session reaching 1309.20, a few cents below the 38.2% retracement of this year rally. Tensions in Ukraine continued to escalate with Russia positioning its troops along the east Ukrainian border prompting investors into the safe haven metal. Technically, the hourly chart shows indicators easing some from extreme overbought levels, albeit still far from supporting a stronger downward correction, while 20 SMA advanced above 200 EMA, adding to the bullish case. In the 4 hours chart indicators remain in positive territory, albeit losing some of the strong upward momentum seen earlier on the day. A break above the critical resistance should trigger an upward continuation that can extend up to 1325 price zone, with 1302.70 as immediate short term support.
Support: 1302.70 1294.90 1285.00
Resistance: 1309.30 1316.30 1325.50 