Get 40% Off
These stocks are up over 10% post earnings. Did you spot the buying opportunity? Our AI did.Read how

Game Of Trends: Gold And Silver Resumed Their Dominant Trends

Published 04/12/2015, 02:26 AM
Updated 07/09/2023, 06:31 AM

U.S. Markets remain trading within larger patterns, or range-bound, but are approaching upper levels within those ranges while the dominant trend remains higher.

Stocks are setting up better charts by the day and have really come around in the last week or two and it does finally look like we will see a sustainable breakout where I can get all into stocks for 6 to 8 weeks.

Of course, I have been and can be wrong again so I’m always ready to get out of stocks just as quickly.

I’m playing relatively small at the moment but the stocks I am holding are doing fabulously well overall.

Gold and silver resumed their dominant trends lower off the support levels I gave to you in this weekend letter last week.

Let’s see what I can spot on the precious metals charts this weekend before I really dive into the best looking stocks who are set to finally make a big break for members.
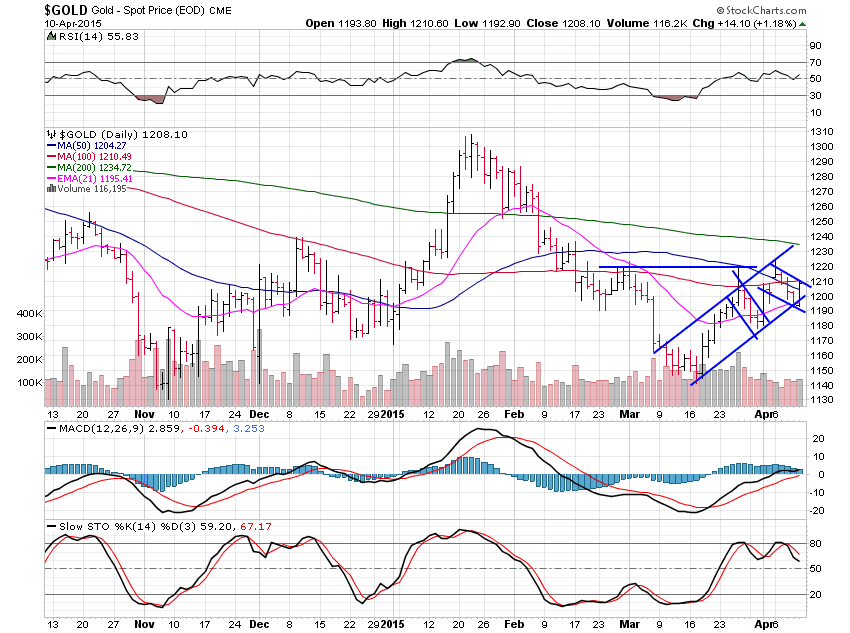
Gold Daily Chart

Gold gained only 0.47% this past week even after a strong Friday.

Gold ran into the $1,220 resistance level and backed right off and was about to breakdown under the rising channel at $1,190 which would have been a short level before rebounding.

So far, gold remains in this ascending channel with small descending channels within, so until that pattern changes, you can trade it.

This pop off support should target the 200 day moving average at $1,235 where gold will have some serious soul-searching to do and chances are we will not be able to break above $1,235 with any conviction, thus leaving the dominant trend in place.

3rd party Ad. Not an offer or recommendation by Investing.com. See disclosure here or remove ads .

I still think we need the capitulation/blood in the streets moment and all I see in the gold sphere is complacency.
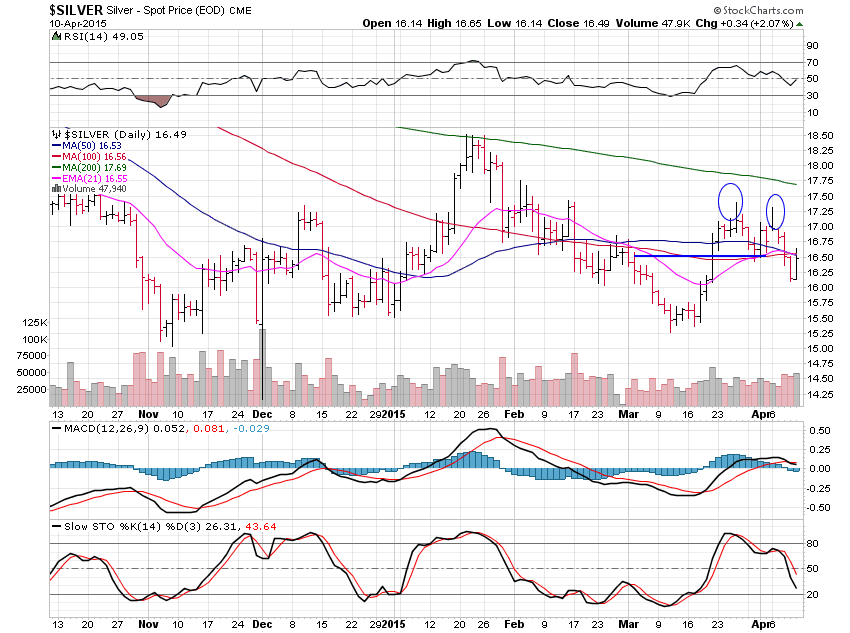
Silver Daily Chart

Silver lost 1.58% this past week and was leading gold lower very nicely before Friday’s pop.

This 16.50 area can either be support or resistance and since we closed right on it Friday we just have to see which way we move Monday.

This chart suggest it will continue lower while gold looks to want a small move higher so let’s see who will grab the leading role in the days ahead.

I wish I could say what goes where and when but I just react and tell you when I see certain high probability setups in the charts.
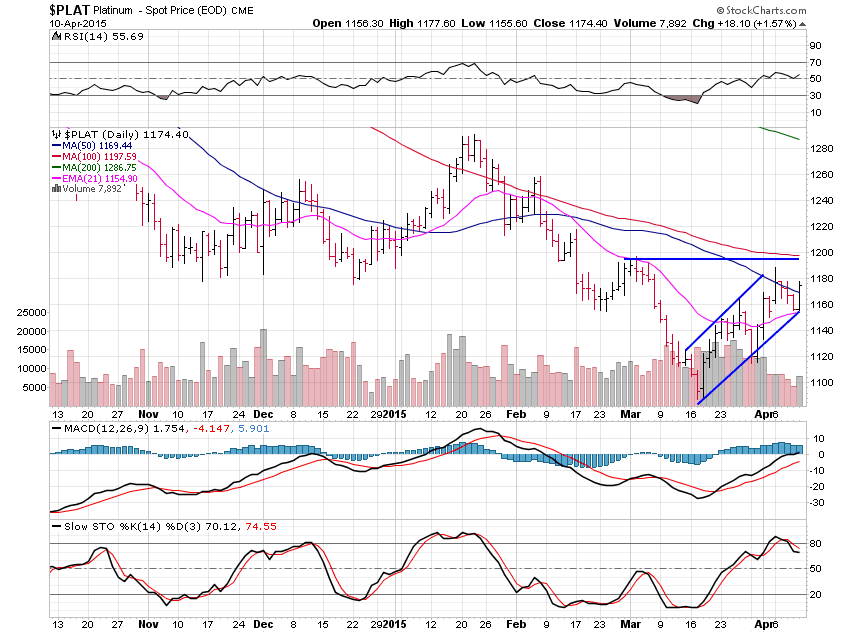
Platinum Daily Chart

Platinum gained 1.70% this past week and is approaching resistance at $1,200 where it should see this pop end.

There really isn’t much volume on this move higher which means conviction is low.
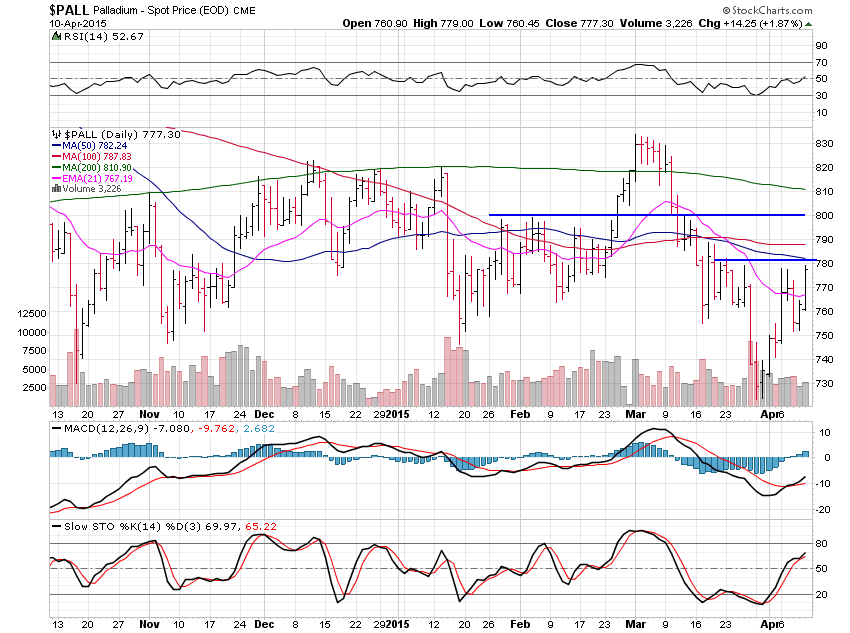
Palladium Daily Chart

Palladium gained a solid 4.08% this past week and looks great.

This sharp V bottom should push palladium up to $800 if it can best $780 but as always, palladiums action will be dictated by how gold and silver move.

The moving averages I post always pose resistance and palladium has the 50 day right here at $780 and the 100 day average at the $790 area so the move to $800 will need some conviction.

It’s close to time to get heavy into stocks after waiting patiently.

3rd party Ad. Not an offer or recommendation by Investing.com. See disclosure here or remove ads .

Latest comments

EVERYONE always wants to see blood in the streets. its probably been spilled and you missed it. the blood that ran isnt returning, and wont till a major buy signal is in place. those like bevan who want blood in the streets only want a cheaper point to initiate a position, its called greed. and the greedy become the needy. on this sunday may i remind you to read james 4 13-15. may do you some good in your market analysis.
Risk Disclosure: Trading in financial instruments and/or cryptocurrencies involves high risks including the risk of losing some, or all, of your investment amount, and may not be suitable for all investors. Prices of cryptocurrencies are extremely volatile and may be affected by external factors such as financial, regulatory or political events. Trading on margin increases the financial risks.
Before deciding to trade in financial instrument or cryptocurrencies you should be fully informed of the risks and costs associated with trading the financial markets, carefully consider your investment objectives, level of experience, and risk appetite, and seek professional advice where needed.
Fusion Media would like to remind you that the data contained in this website is not necessarily real-time nor accurate. The data and prices on the website are not necessarily provided by any market or exchange, but may be provided by market makers, and so prices may not be accurate and may differ from the actual price at any given market, meaning prices are indicative and not appropriate for trading purposes. Fusion Media and any provider of the data contained in this website will not accept liability for any loss or damage as a result of your trading, or your reliance on the information contained within this website.
It is prohibited to use, store, reproduce, display, modify, transmit or distribute the data contained in this website without the explicit prior written permission of Fusion Media and/or the data provider. All intellectual property rights are reserved by the providers and/or the exchange providing the data contained in this website.
Fusion Media may be compensated by the advertisers that appear on the website, based on your interaction with the advertisements or advertisers.
© 2007-2024 - Fusion Media Limited. All Rights Reserved.