Get 40% Off
These stocks are up over 10% post earnings. Did you spot the buying opportunity? Our AI did 😎Read how

Stock Market Sees Further Losses But No Breakaway

Published 02/12/2016, 12:02 AM

The Asian session had set up for big losses, but markets were able to defend against such losses even if finishing with a lower close.

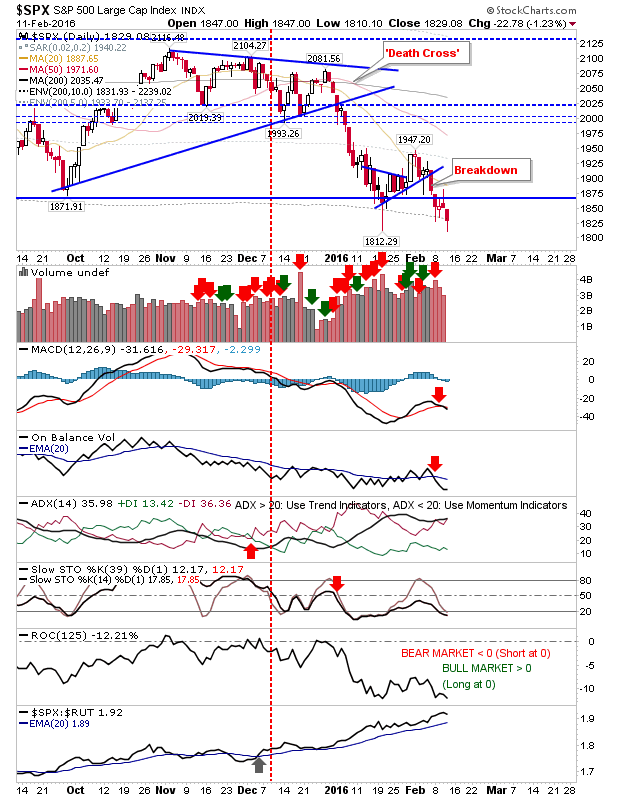
The S&P tagged the January low, but it's hard to see it holding out if there's another challenge on 1,810.

SPX Daily Chart


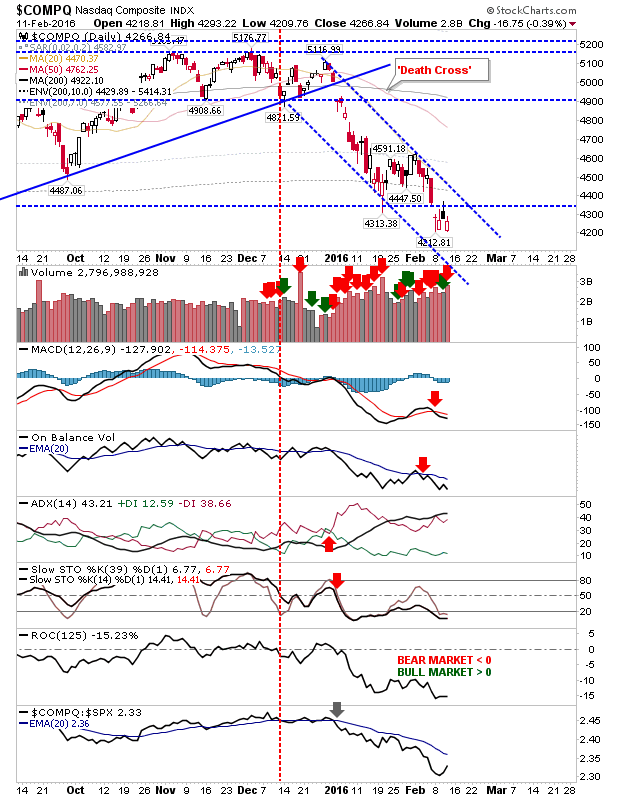
The Nasdaq was able to register a higher close (although below the prior day's close). It probably did enough to negate what is normally a bearish black candlestick, but bulls won't have any confidence until the bearish channel is broken.

COMPQ Daily Chart


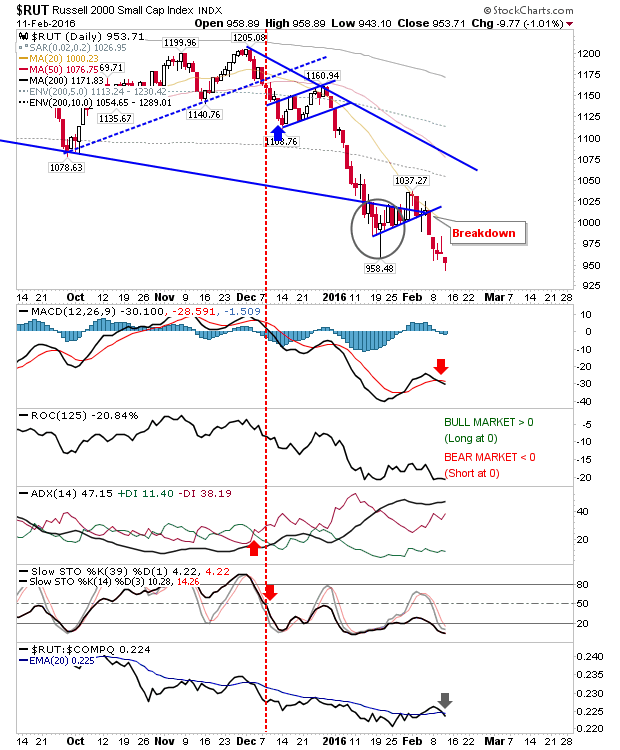
The Russell 2000 was the index feeling the most heat. The gap down didn't manage to do more than leave a small bullish hammer. The MACD trigger 'sell' expanded, and new lows keep pricing action on the side of bears. As the relative market leader, what goes here goes for other indices.

RUT Daily Chart


Friday is a chance for bulls to buy a change in fortune. After five consecutive days of losses it's time for bulls to apply the squeeze.

Latest comments

Risk Disclosure: Trading in financial instruments and/or cryptocurrencies involves high risks including the risk of losing some, or all, of your investment amount, and may not be suitable for all investors. Prices of cryptocurrencies are extremely volatile and may be affected by external factors such as financial, regulatory or political events. Trading on margin increases the financial risks.
Before deciding to trade in financial instrument or cryptocurrencies you should be fully informed of the risks and costs associated with trading the financial markets, carefully consider your investment objectives, level of experience, and risk appetite, and seek professional advice where needed.
Fusion Media would like to remind you that the data contained in this website is not necessarily real-time nor accurate. The data and prices on the website are not necessarily provided by any market or exchange, but may be provided by market makers, and so prices may not be accurate and may differ from the actual price at any given market, meaning prices are indicative and not appropriate for trading purposes. Fusion Media and any provider of the data contained in this website will not accept liability for any loss or damage as a result of your trading, or your reliance on the information contained within this website.
It is prohibited to use, store, reproduce, display, modify, transmit or distribute the data contained in this website without the explicit prior written permission of Fusion Media and/or the data provider. All intellectual property rights are reserved by the providers and/or the exchange providing the data contained in this website.
Fusion Media may be compensated by the advertisers that appear on the website, based on your interaction with the advertisements or advertisers.
© 2007-2024 - Fusion Media Limited. All Rights Reserved.