The performance of the US stock market is quite impressive considering that there isn’t much of a spring in the latest batch of economic indicators. The winter’s ice patch is looking more and more like the spring’s soft patch--all the more reason to expect either one-and-done or none-and-done from the Fed. Consider the following:
(1) Business surveys. Three of the six regional business surveys that I track are available through April. The averages of their composite indexes tend to be highly correlated with the national M-PMI. The average for the FRB districts of Kansas City, New York, and Philadelphia fell to -0.2 this month from 2.6 last month and a recent peak of 18.8 during November of last year. It’s the lowest since May 2013.
The average of the three new orders indexes was -5.8 this month, about the same as last month’s -6.2, which was the lowest since October 2012. The employment index fell to 1.0, the lowest since November 2013.
(2) Flash M-PMI. The national flash M-PMI compiled by Markit fell from 55.7 in March to 54.2 this month. The ISM’s M-PMI was much weaker than Markit’s reading in March. The same is likely this month given the weakness of the available regional surveys so far.
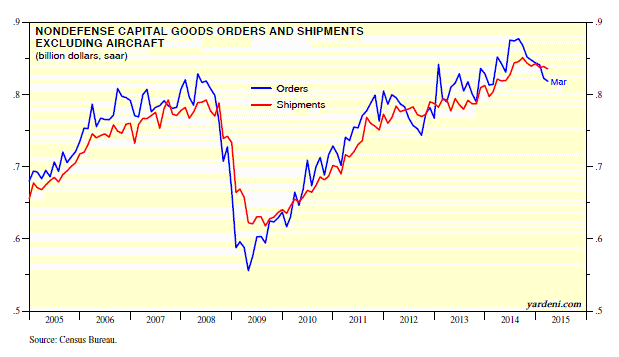
(3) Durable goods orders. The weakness in the regional orders indexes was confirmed by Friday’s release of March durable goods orders. While the overall number rose 4.0% m/m, boosted by a surge in aircraft orders, non-defense capital goods orders excluding aircraft fell for the seventh consecutive month through March, by a total of 6.7%. Orders have been especially weak for primary metals, fabricated metal products, machinery, and electrical equipment, appliances, and components. That probably reflects the combined depressing impact of lower oil prices on the energy industry and the higher dollar on exports.
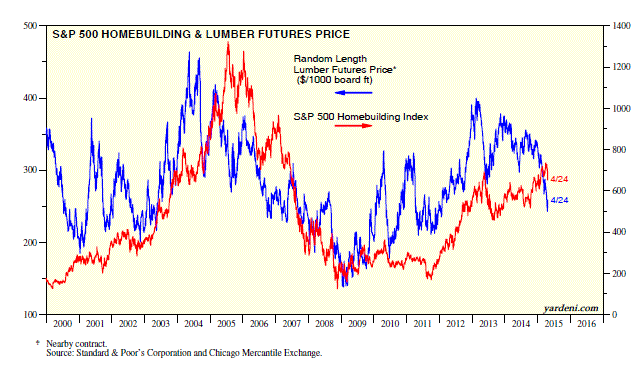
(4) Lumber prices. In recent days, I’ve noted the plunge in lumber prices since the beginning of the year through Wednesday. That’s not a good omen for housing starts or the S&P 500 Homebuilding Index. Neither is the flat trend in railcar loadings of lumber and wood products over the past year. New home sales fell 11.4% m/m during March.
Today's Morning Briefing: Conspiracy Theories. (1) Compelling narratives without any proof. (2) The central bankers are doing it in broad daylight. (3) Bonds and stocks achieve “escape velocity,” while economies don’t. (4) Connecting the dots in Chicago. (5) Fed’s bunker in Chicago. (6) Bernanke’s new job in Chicago. (7) Spoofing the CME in Chicago. (8) Crash Boys: Michael Lewis has some questions for CME and CFTC. (9) Meet Sarao and Aleyniko. (10) Goldman’s sinister algorithm. (11) The stock market is high on life. (12) More soft-patch indicators in the US. (13) Flash-fried PMIs. (14) “House of Clinton” (+ + +).

