The Hoot
Actionable ideas for the busy trader delivered daily right up front
- Friday higher, low confidence.
- ES pivot 2001.33. Holding above is bullish.
- Next week bias uncertain technically.
- Monthly outlook: bias higher.
- ES Fantasy Trader standing aside.
Recap
Ho ho ho! Looks like Santa showed up, right on schedule, delivering the Dow's best one day performance since the late Mesozoic with a whopping 421 point moonshot, the biggest gain I remember since I started doing this. And the last two days have erased almost all of last week's sickening declines.
The Technicals
The Dow: The Dow, I figured we were going higher on Thursday but after Wednesday's nice rally I didn't think Mr. Market still had that much gas in the tank. But yesterday's action rocketed us right out of the recent ugly descending RTC for a bullish trigger, solidified the bullish stochastic crossover, and kept the indicators rising off oversold. So with two big white soldiers on the march, this chart looks like Santa's not done delivering presents to all the good little traders.
 |
| VIX daily |
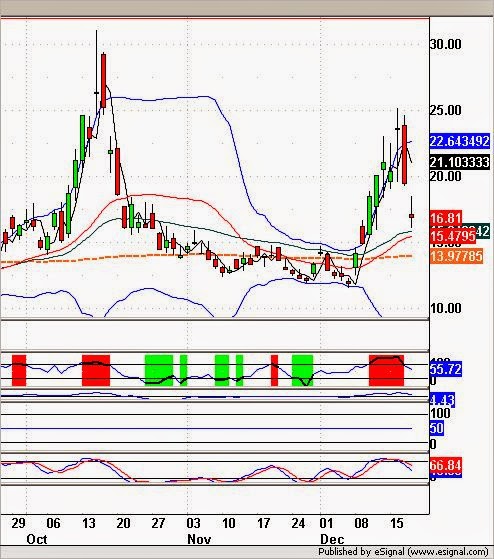
The VIX: This is quite extraordinary. Wednesday night I wrote "The pattern looks amazingly similar to what we saw back in October. ...If this holds up, we should be in for more declines on Thursday." Now look at how it turned out yesterday. On October 15th we had a long-legged star trading above the upper BB®, just like December 16th.
On October 16th, we got a tall red marubozu dropping back under the upper BB®, just like on Wednesday. And on October 17th, we got a gap-down doji star, just like yesterday (Thursday)! Even the indicators are all in the same relative positions. This is how the VIX trades. I hate to say never, but I've never seen this fail. In any case, this chart looks good for some more downside today.
Market index futures: Last night, all three futures were higher at 1:09 AM EST with ES up 0.53% yesterday ES put in the best one day gain I've ever seen to leave its descending RTC in the dust for a bullish trigger and sent the indicators steadily marching away from oversold.
You'd think Mr. Market would be kind of pooped after such a massive two day run, but no, not only are we up significantly in the overnight, we're back to flirting with record highs just under 2079, a level that looked like ancient history just a few days ago. We've now retraced the entire week-long oil induced tumble. And it appears that this rally isn't done yet.
ES daily pivot: Tonight the ES daily pivot zooms from 2001.33 to 2047.92. And even with that massive gain we're still well above the new pivot so this indicator continues bullish.
The Dollar: Even the Dollar managed a 0.17% gain on Thursday with a little gap-up star that came close to its upper BB®. That's a reversal hint but one which requires confirmation, especially with indicators still not yet overbought.
Euro: And the euro lost again yesterday for a bearish RTC trigger along with falling indicators. I'd say we're headed to the lower BB at 1.2257 on Friday.
Transportation: Yesterday, the Trans, like everything else had a great day gapping up out of their descending RTC for a bullish setup and confirming Wednesday's hammer. Indicators all rising off oversold make this chart look bullish.

I really think Mr. Market deserves a rest after rallying furiously for two days but it looks like there's just no stopping him. With the Dow and SPX back near record highs, I think he's going to want to take another look at those levels. We could see a topping day but since I don't see any bearish signs anywhere, I've got to call today Friday higher.
That's all she wrote. Reminder - I'm taking all of next week off due to the extended major holiday for Christmas. See you again Sunday the 28th.
ES Fantasy Trader
Portfolio stats: the account now stands at $110,500 after ten trades in 2014, starting with $100,000. We are now 7 for 10 total, 5 for 5 long, 2 for 4 short, and one push. Tonight we stand aside.
