The good news is that the results I am about to show you will quite possibly leave you stunned and amazed.
The bad news is that I am not entirely sure that it will actually do you any good.
In my last article I noted that during the months of August, September and October, Ford (NYSE:F) stock has lost roughly 95% since 1973. Well as it turns out, if we take an even deeper look “under the hood”.
Difficult Days (of the Month) for Ford
First let me state for the record that, Yes, I am aware that I can be accused of “curve-fitting” with what I am about to show you next. Still, the trends have been so persistent over the last 40+ years that I can’t help but to think that there is “something there”.
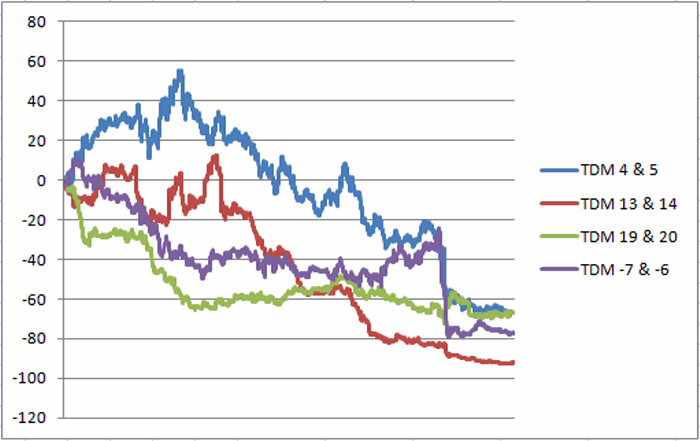
For this test we will look at each trading day of the month sequentially and note the cumulative performance of Ford stock on that particular trading day of the month. In particular:
- Trading Days 4 and 5
- Trading Days 13 and 14
- Trading Day 19 and 20
- Trading Days -7 and -6
Trading Days -7 and -6 are arrived at by counting backwards from the last trading day of the month (which is Trading Day -1). During many months Trading Days 13 and 14 may overlap with Trading Days -7 and -6. For now and for illustrative purposes we will look at these two periods separately.
Figure 1 display the cumulative percentage gain or loss (with a big emphasis on the word “loss”) achieved by Ford stock on these particular trading days of the month.
For the record:
- Trading Days 4 and 5 = (-66.8%)
- Trading Days 13 and 14 = (-92.2%)
- Trading Day 19 and 20 = (-67.2%)
- Trading Days -7 and -6= (-77.2%)
These returns (or perhaps I should say “lack of returns”) are what we “quantitative analyst types” refer to in our highly technical terms as “not very good.”
The “No Go Zones” for Ford
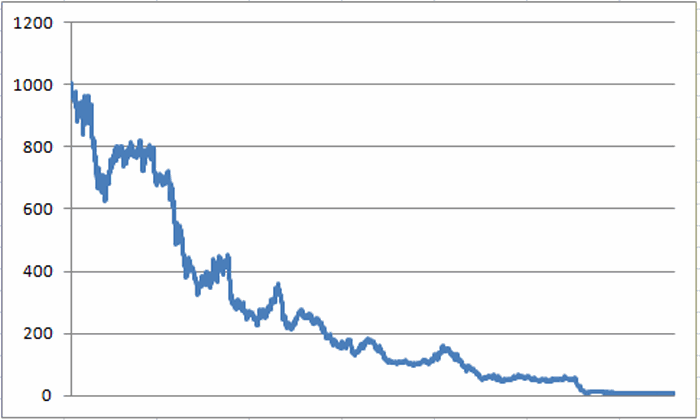
So let’s try this: Forgetting for the moment slippage and commissions, what if an investor had started with $1,000 in 1973 and invested in Ford stock only during these “not very good”?
The results appear in Figure 2 (although if you are the least bit squeamish you might wish to avert your eyes at this point).
For the record:
- 5-year rolling rates of return showed a loss 92% of the time and a gain just 8% of the time.
- The original $1,000 invested this way since 1973 would now be worth $6.61. That represents a loss of -99.3%.
Which is the kind of “return” most investors try to avoid.
Summary
I mentioned earlier that I wasn’t sure that this information would actually do you any good. Just to make the point, to be out of Ford stock during all of the days listed earlier and in Ford stock all of the rest of the time involves somewhere in the range of 75 or so trades per year. So obviously not for everyone.
Still, -99.3% is -99.3%

