Key Points:
- Falling wedge nearing completion.
- Should remain constrained by along-term descending triangle.
- Parabolic SAR remains bullish.
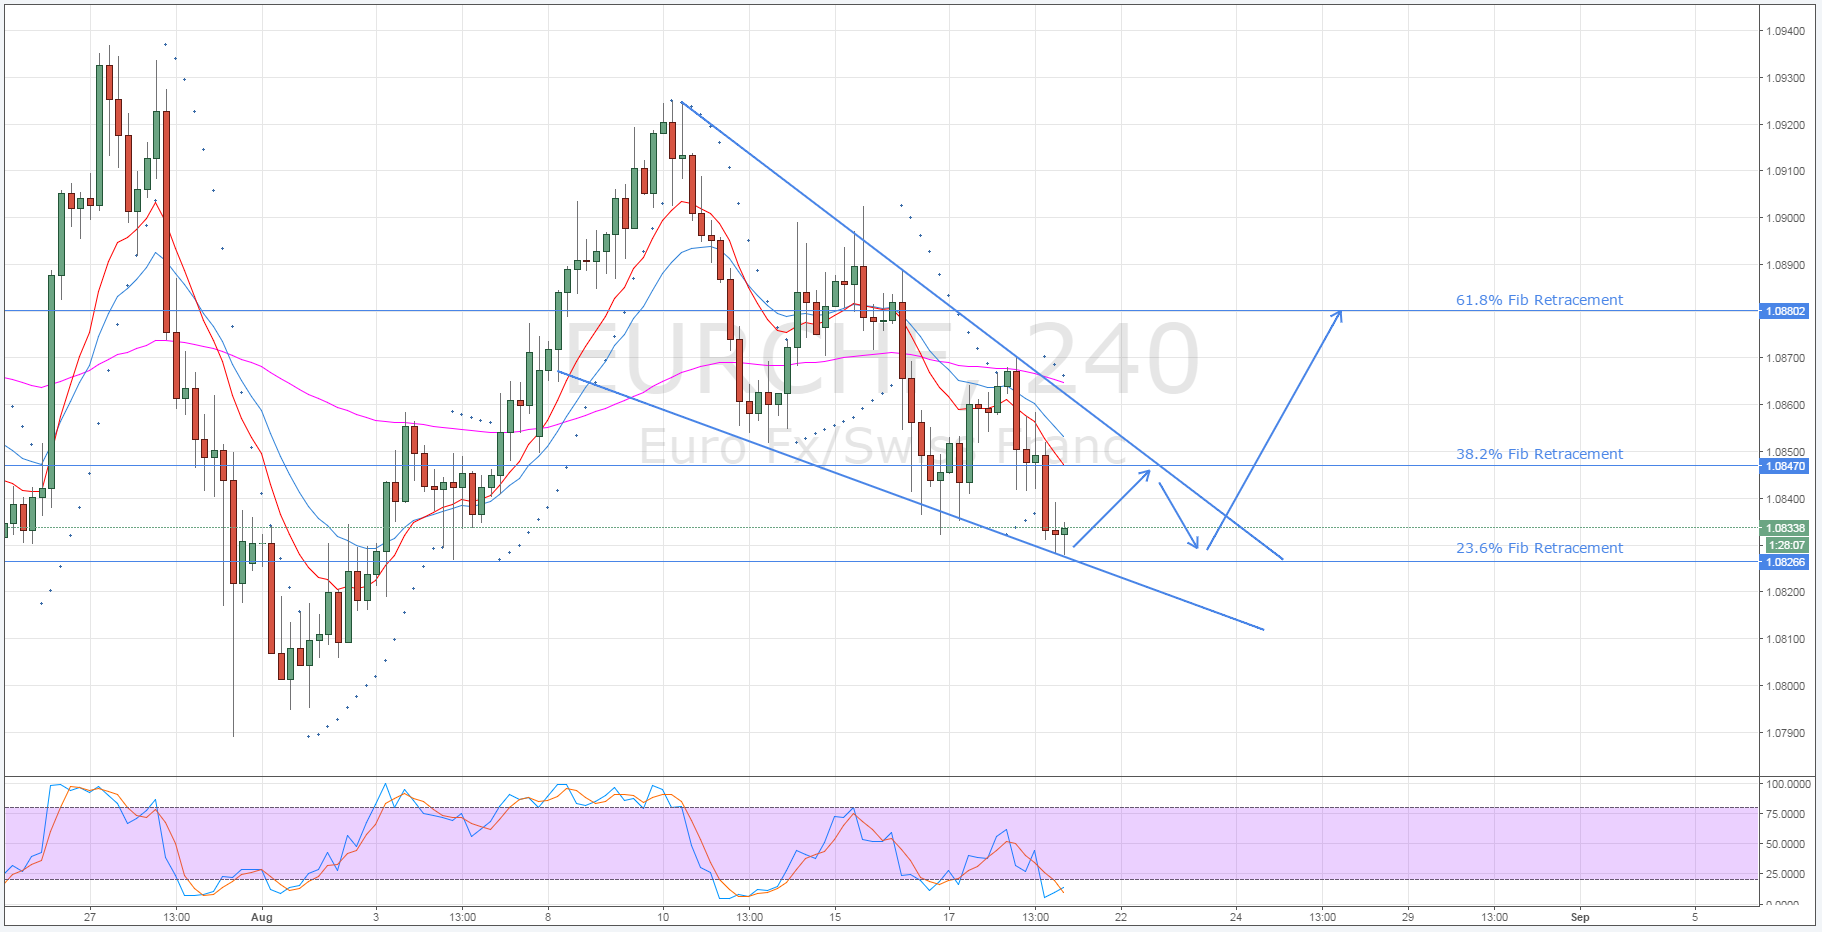
The EUR/CHF is nearing the end of its short-term falling wedge formation and this could see the pair make a fairly substantial recovery in the coming days.
Specifically, this upside breakout could bring the pair back into contact with the upper constraint of the long-term descending triangle pattern at around the 1.0883 level.
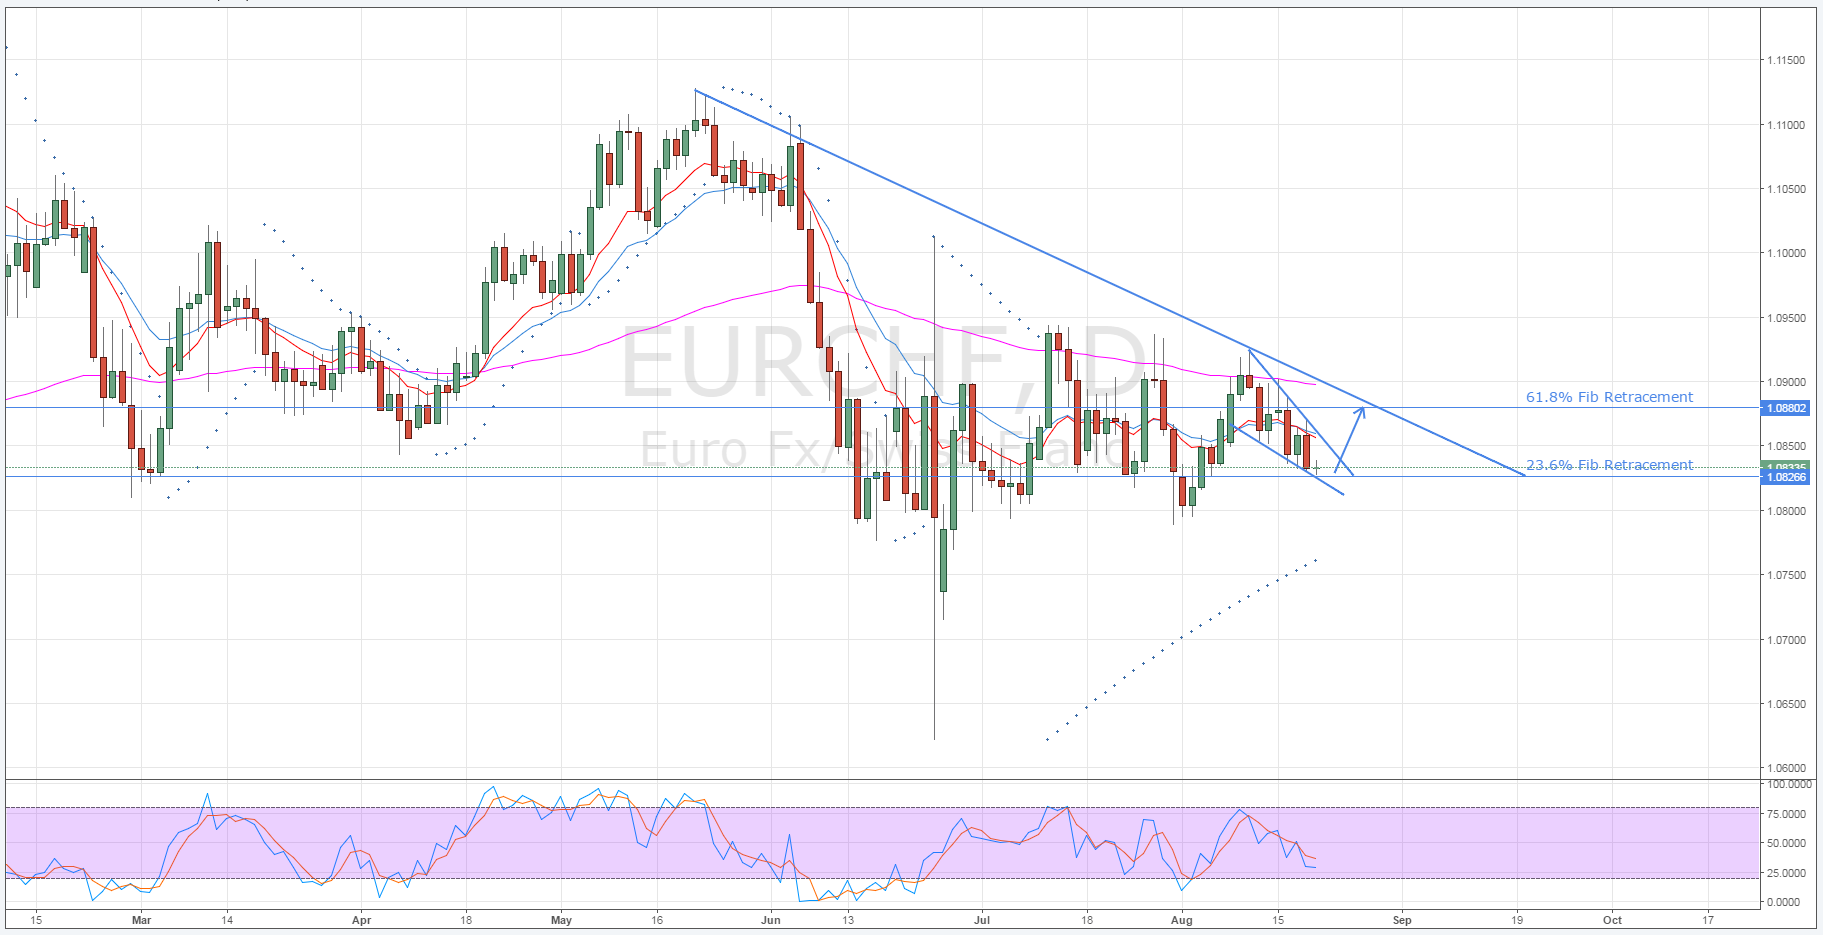
However, if this occurs, it remains likely that the EUR/CHF will be constrained by the long-term trend and will stay bearish until at least mid-September.
Firstly, looking at the H4 chart, it is relatively self-evident that the EUR/CHF has been declining in a falling wedge configuration for the past week or so. However, it is also now becoming clear that this recent slip could be nearing completion as the pair reaches the 23.6% Fibonacci level around the 1.0826 price.
This being said, the EUR/CHF is expected tobounce between the upper and lower constraints of the wedge at least once more prior to any potential breakouts.

As shown above, there is some fairly robust resistance inplace around the 1.0847 mark as this represents an intersection of the falling wedge’s upside constraint and the 38.2% Fibonacci level. This is chiefly the reason why the pair is expected to reverse at this point and not breakout until its subsequent rally.
Likewise, the reason one can be relatively confident that the EUR/CHF is not simply going to push through its current support is because this is the intersection of the downside constraint and the 23.6% Fibonacci retracement.
Once the pair has broken free of the falling wedge pattern, it should begin to climb up to around the 1.0883 level before reversing and continuing with its long-term bearishness.
This reversal will be the result of the rather heavy downward pressure being supplied by not only the 61.8% Fibonacci level, but also the upper constraint of the long-term descending triangle formation.
As is shown below, this triangle is still very much intact and when combined with the daily EMA readings, this should keep the selling pressure on for a significant period of time.

Whilst the direction of the imminent breakout is relatively certain, exactly which direction the pair will breakout in once the triangle has completed is less clear cut. As a result, fundamentals will likely become vital as the EUR/CHF reaches the end of this pattern in mid-September.
However, the daily Parabolic SAR currently retains its long-term bullish bias which could be hinting that the pair is set to push higher come September.
