Sometimes an idea sounds very sensible but doesn’t end up looking so great in practice. And some ideas work out great in practice (caveat: at least for awhile) but don’t necessarily make a lot of sense.
Today, let’s consider one in the latter category.
First off, did you know that there is an investment “category” known as “European Small-Cap Dividend”? Neither did I. But there is. That might just be because the marketing people stay up late thinking up new investment categories, but no matter. DFE is the WisdomTree Europe Small-Cap Dividend ETF.
This ETF holds a portfolio that tracks an index known – not coincidentally – as the WisdomTree Europe SmallCap Dividend Index. According to ETFDB.com (a terrific website by the way for ETF investors), “The WisdomTree Europe SmallCap Dividend Index is a fundamentally weighted index that measures the performance of the small-capitalization segment of the European dividend-paying market. The Index is comprised of the companies that compose the bottom 25% of the market capitalization of the WisdomTree Europe Dividend Index after the 300 largest companies have been removed. Companies are weighted in the Index based on annual cash dividends paid.”
Got that?
Overall Performance
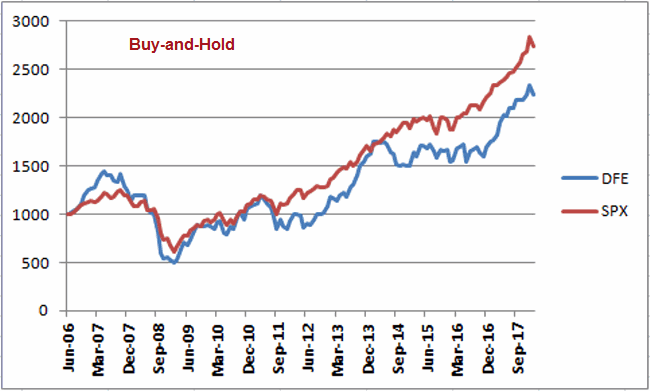
Ticker DFE started trading in July 2006 and overall results have been, um, “meh.” Figure 1 displays the growth of $1,000 invested in DFE on a buy and hold basis versus the S&P 500 index.

Figure 1 – Buy-and-Hold DFE versus SPX (7/2006-2/2018)
For the record, (using monthly total return data) buying and holding since July 2006:
- DFE gained +124% versus +174% for SPX
- DFE median 12 months = +9.2% versus median 12 months = +14.4% for SPX
- DFE maximum drawdown = -65.7% (ouch!) versus -50.9% for SPX
So no great shakes, right? But a weird thing happens if we break out certain months.
Seasonally Favorable Months For DFE
First the caveats: The results that follow are derived with the benefit of hindsight so no assumption should be made that they will hold true ad infinitum into the future. Also – as always – I am not “recommending” that anyone adopt what follows as a strategy. It is presented simply as “information” regarding an interesting (and quite frankly – unexplainable) trend.
- Favorable months for DFE = Feb/Mar/Apr/Jul/Dec (i.e., hold DFE only during same 5 months every year)
- All other months are considered “Unfavorable” (i.e., do NOT hold DFE during these months)
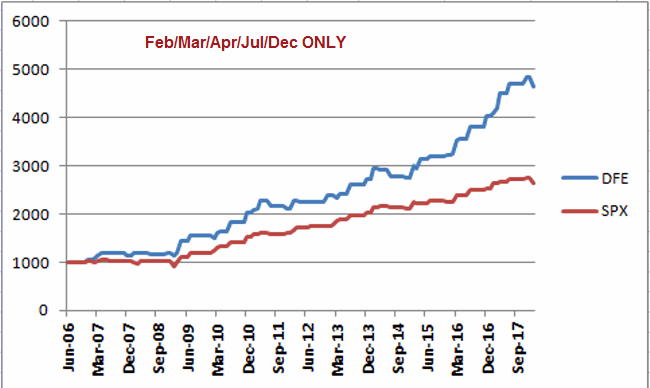
Figure 2 displays the growth of $1,000 invested in DFE ONLY during the “Favorable Months” of February, March, April, July and December (blue line), versus holding the S&P 500 Index during those same months (red months).
Figure 2 – Growth of $1,000 invested during “Favorable Month” ONLY; DFE versus SPX (7/2006-2/2018)
For the record, during the “Favorable Months”:
- DFE gained +379% versus +221% for SPX
- DFE median 12 months = +17.1% versus median 12 months = +7.5% for SPX
- DFE maximum drawdown = -6.7% versus -13.4% for SPX
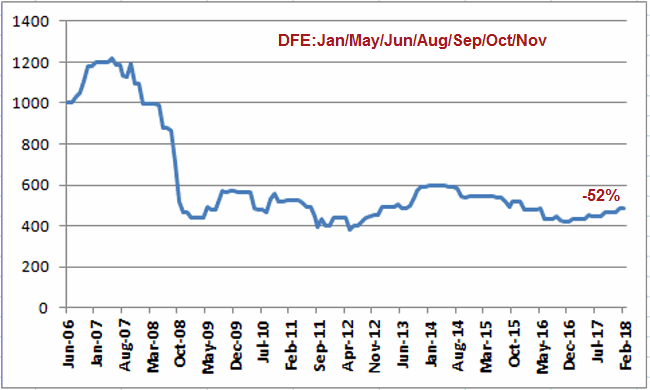
What about the “unfavorable” periods? DFE has lost over -50% during those months since 2006 as shown in Figure 3.

Figure 3 – Unfavorable months for DFE (7/2006-2/2018)
Summary
So is there a viable strategy here? The answer to that question would appear to be “it’s in the eye of the beholder.” The results to date of investing in “Europe Small-Cap Dividend” stocks during 5 favorable months look pretty good.
But does it make sense? I leave it to you the reader to decide for yourself.
