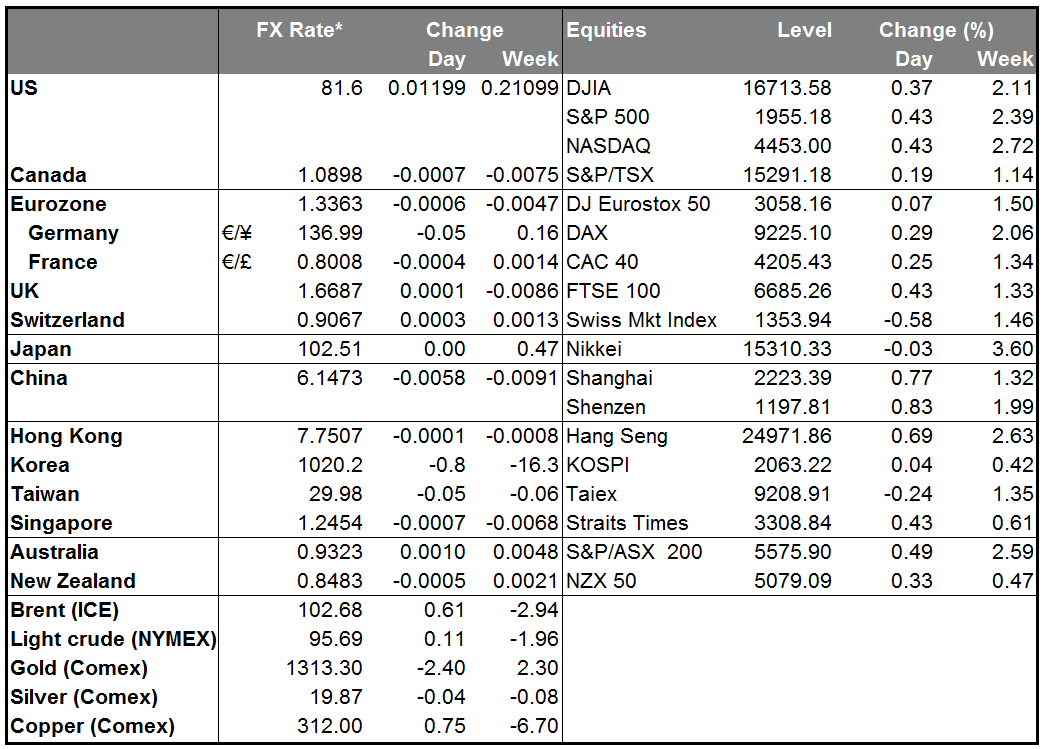
It’s said that every cloud has a silver lining – that everything bad has something good about it – but nowadays its seems more like everything bad is entirely good and every cloud is entirely silver. Yesterday’s economic news was all-around bad, and as a result we had a rally in stocks, bonds and credit, as if it was the greatest news possible. The Eurozone capped off a string of bad economic indicators recently with lower-than-forecast GDP, showing that the continent’s economy is basically stagnating, while professional forecasters lowered their forecast for both growth and inflation this year. Meanwhile on the other side of the ocean, initial jobless claims were higher than expected, contradicting some of the recent better news on the labor market.
There was some traditionally good news yesterday: Russian President Vladimir Putin travelled to a much-hyped meeting in Crimea and called for an end to the conflict “as soon as possible.” The cautious speech was taken as a signal that he wants to de-escalate the crisis. (Although personally, I doubt whether things are over quite yet: two British newspapers reported seeing Russian armored vehicles enter Ukraine Thursday evening, while the Pentagon announced it would send around 600 US soldiers and their equipment, including tanks, to Poland and the Baltic states. The US presence in countries that border Russia is not going to make Mr. Putin particularly happy.)
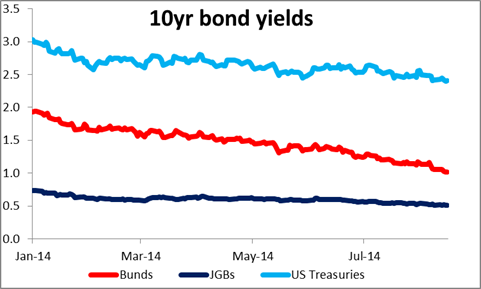
In any event, hopes for an early settlement to the Ukraine strife plus thoughts that neither the ECB nor the Bank of England nor the Fed is likely to start hiking any time soon encouraged the flow back into any and all financial assets. Bond yields headed lower, with 10-year Bunds breaking through 1.0% for the first time ever and 10-year US Treasuries slipping below 2.40%. Bunds are now only 50 bps or so above JGBs, the bonds of a country where the central bank is buying up more bonds than the government can issue. The VIX index continued to decline and high yield bonds rallied as money came back into the credit market too. But the dollar remained stable against most of the G10 currencies and EUR/USD stayed within its recent narrow range and once again failed to break the 1.3330 support (low for the day: 1.3349). The commodity currencies were the main gainers, which is kind of odd when you consider that commodities didn’t do that well – Copper was down, oil fell sharply as the supply glut continued and agricultural commodities were generally lower too.
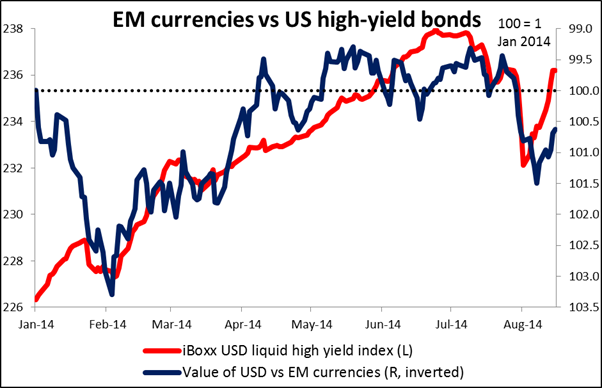
FX market implications: carry continues to climb The general financial euphoria had its counterpart in EM FX, where carry trades are back in fashion. Almost all the EM currencies that we track gained against the USD (THB was the only exception). The best performing currency was BRL, which had fallen after an opposition candidate for President was killed Wednesday in a plane crash. The eastern European currencies did well too, outpacing the RUB’s gains. I expect to see more and more carry trades put on as DM bond yields fall and the higher yields available in EM become relatively more attractive. MXN and the Eastern European currencies (PLN and HUF in particular) seem the likely beneficiaries, in my opinion. Investors interested in putting on carry trades might want to consider buying these currencies against EUR, which I expect to decline further sooner or later, or JPY, where pressure is building for further measures to weaken the currency.
Today’s events: UK GDP, US IP, Canadian unemployment correction During the European day, the main event will be the second estimate of UK Q2 GDP. Following the disappointing inflation report on Wednesday and especially the halving of the wage growth forecast, a strong reading is needed for GBP to resume its upward path. The market forecast is as usual the same as the initial estimate, i.e. +0.8%.
In the US, industrial production and PPI for July are due out. Given the soft retail sales Wednesday, the greenback will need a solid industrial production to regain its glamour. It’s not clear whether the forecast of +0.3% mom, a rise from +0.2% mom in June, would be sufficient. The Empire State manufacturing survey and the preliminary U of Michigan consumer confidence sentiment for August are also coming out. The former is expected to decline while the latter is forecast to improve, leaving a mixed picture.
From Canada, we get manufacturing sales for June and existing home sales for July. The re-release of July’s employment report is also due out after Statistics Canada found an error in the original report published last Friday. (The revised report was originally supposed to be published on Thursday, but the release date was later changed.) We would expect CAD to strengthen if it comes in above 20.0k, the original market forecast for the figure. However, a disappointing figure combined with the estimated slowdown in manufacturing sales is likely to weaken CAD.
We have no speakers on Friday’s agenda.
The Market
EUR/USD still ranging
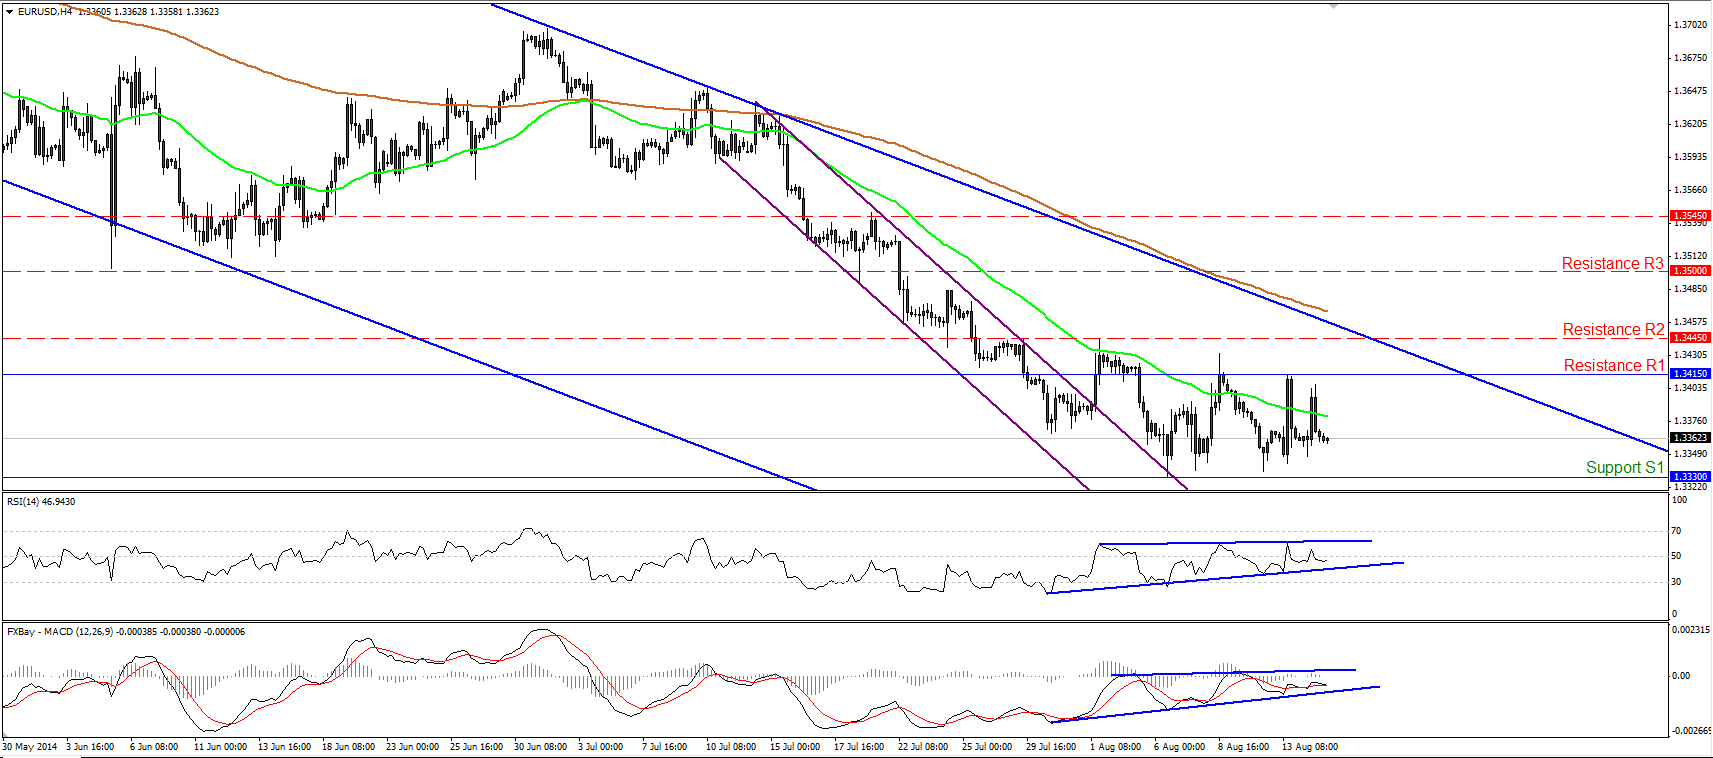
EUR/USD continued oscillating within the range between the support barrier of 1.3330 (S1) and the resistance of 1.3415 (R1). Nevertheless, the rate remains within the long-term blue downside channel, connecting the highs and the lows on the daily chart, and this keeps the overall trend to the downside. As a result, I would retain my flat view for now. I would prefer to see a dip below 1.3300 (S2) before regaining confidence in the downtrend. Such a dip could pave the way towards the 1.3200 (S3) zone. On the daily chart, I see positive divergence between the 14-day RSI and the price action, while the daily MACD moved above is signal line, supporting my view that it is not the best time to follow the long-term downtrend.
• Support: 1.3330 (S1), 1.3300 (S2), 1.3200 (S3)
• Resistance: 1.3415 (R1), 1.3445 (R2), 1.3500 (R3)
EUR/GBP moves above 0.8000
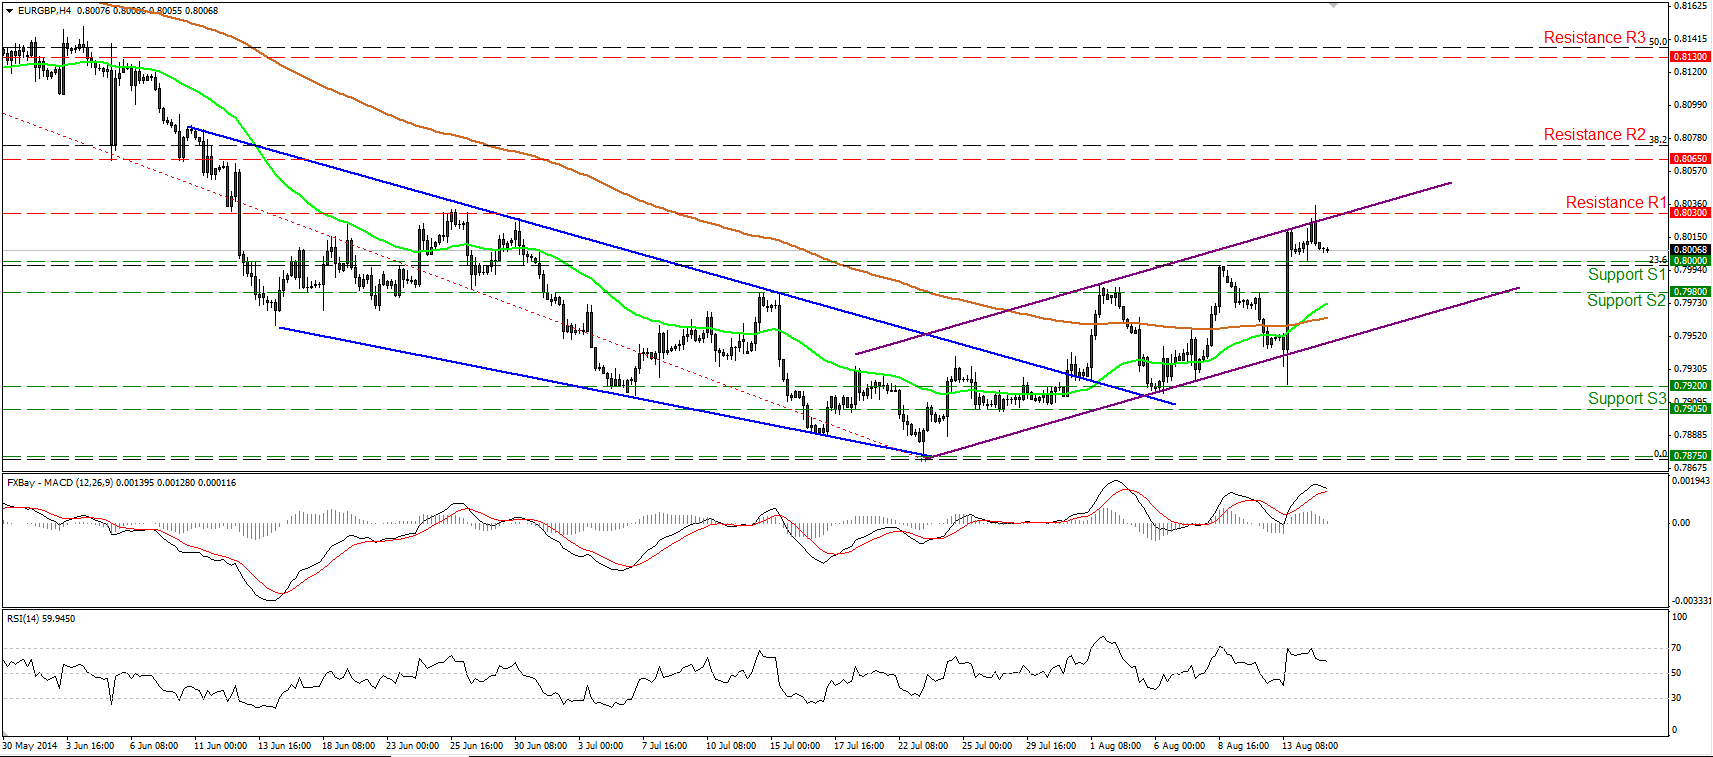
EUR/GBP rallied and moved above the psychological barrier of 0.8000, which coincides with the 23.6% retracement level of the 18th March - 27th of July downtrend, and found resistance at 0.8030 (R1). At the time of writing, the rate is trading near the upper boundary of the short-term purple upside channel. Bearing this and our momentum signs in mind, I would expect the forthcoming wave to be to the downside and I could not rule out a move back below 0.8000 (S1). The RSI found resistance at its 70 line and moved lower, while the MACD shows signs of topping and could fall below its trigger line in the near future. However, as long as the rate is printing higher highs and higher lows within the purple downside channel, the picture remains positive and I would see any future declines within the channel as a pullback or a correcting move.
• Support: 0.8000 (S1), 0.7980 (S2), 0.7920 (S3)
• Resistance: 0.8030 (R1), 0.8065 (R2), 0.8130 (R3)
USD/JPY moves above 102.35
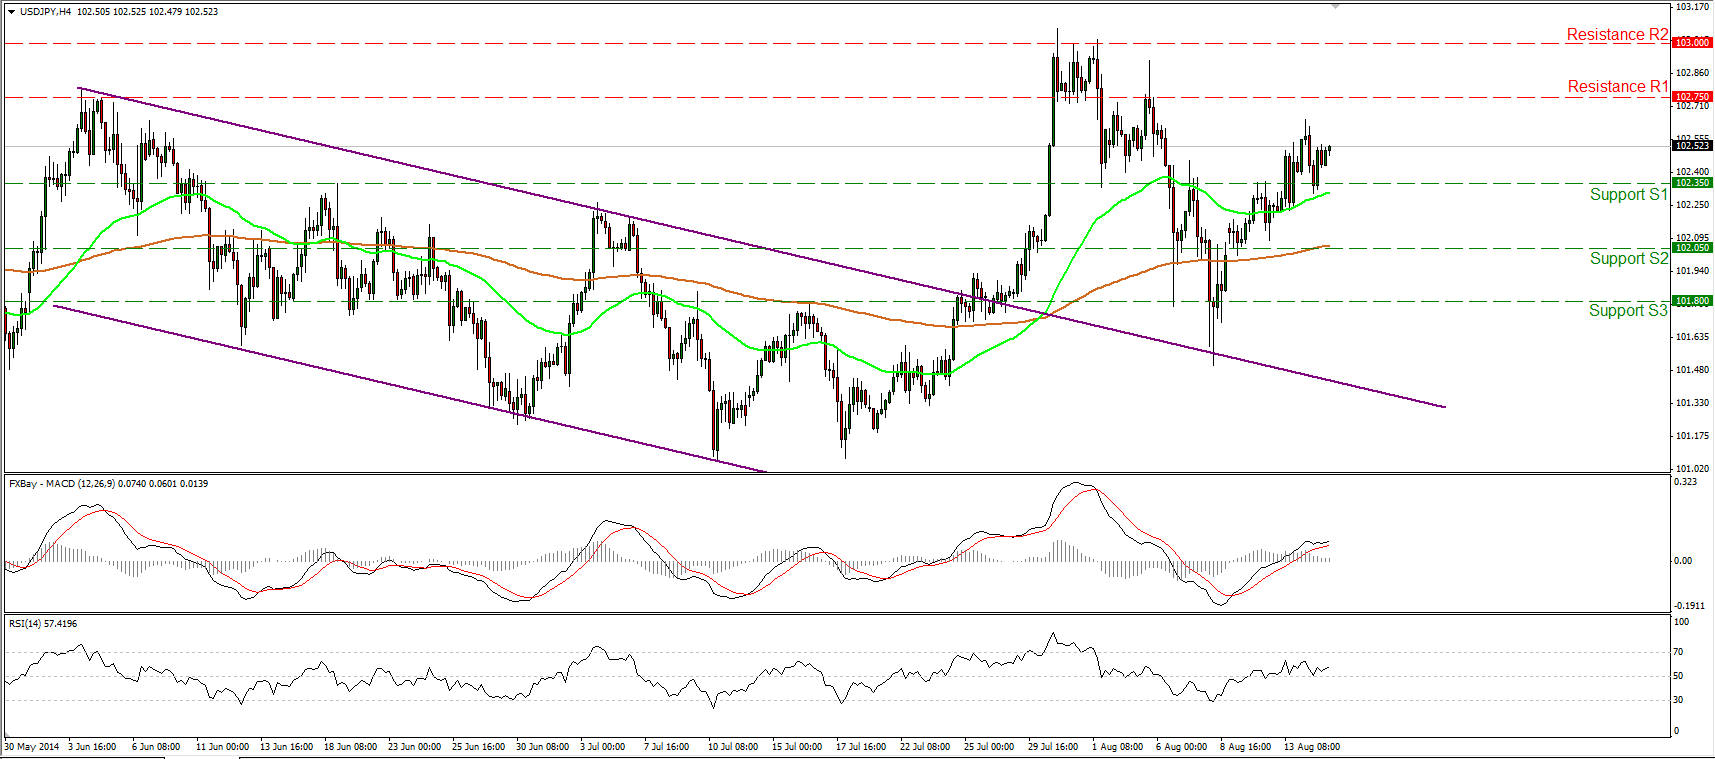
USD/JPY edged above 102.35 on Wednesday and yesterday declined to challenge that barrier as a support. I still believe that the move above that barrier is likely to challenge the resistance obstacle at 102.75 (R1). A decisive violation of the 102.75 (R1) line could target the resistance zone of 103.00 (R2). The RSI lies above its 50 line, while the MACD lies above both its trigger and zero lines. This, alongside the hammer candle on the daily chart, amplifies the case for further upside in the near future. The outlook remains cautiously positive in my view, but I still believe that in the bigger picture, we need a close above the 103.00 (R2) zone to have a higher high on the daily chart and a possible newborn long-term uptrend.
• Support: 102.35 (S1), 102.05 (S2), 101.80 (S3)
• Resistance: 102.75 (R1), 103.00 (R2), 104.00 (R3)
Gold still trendless
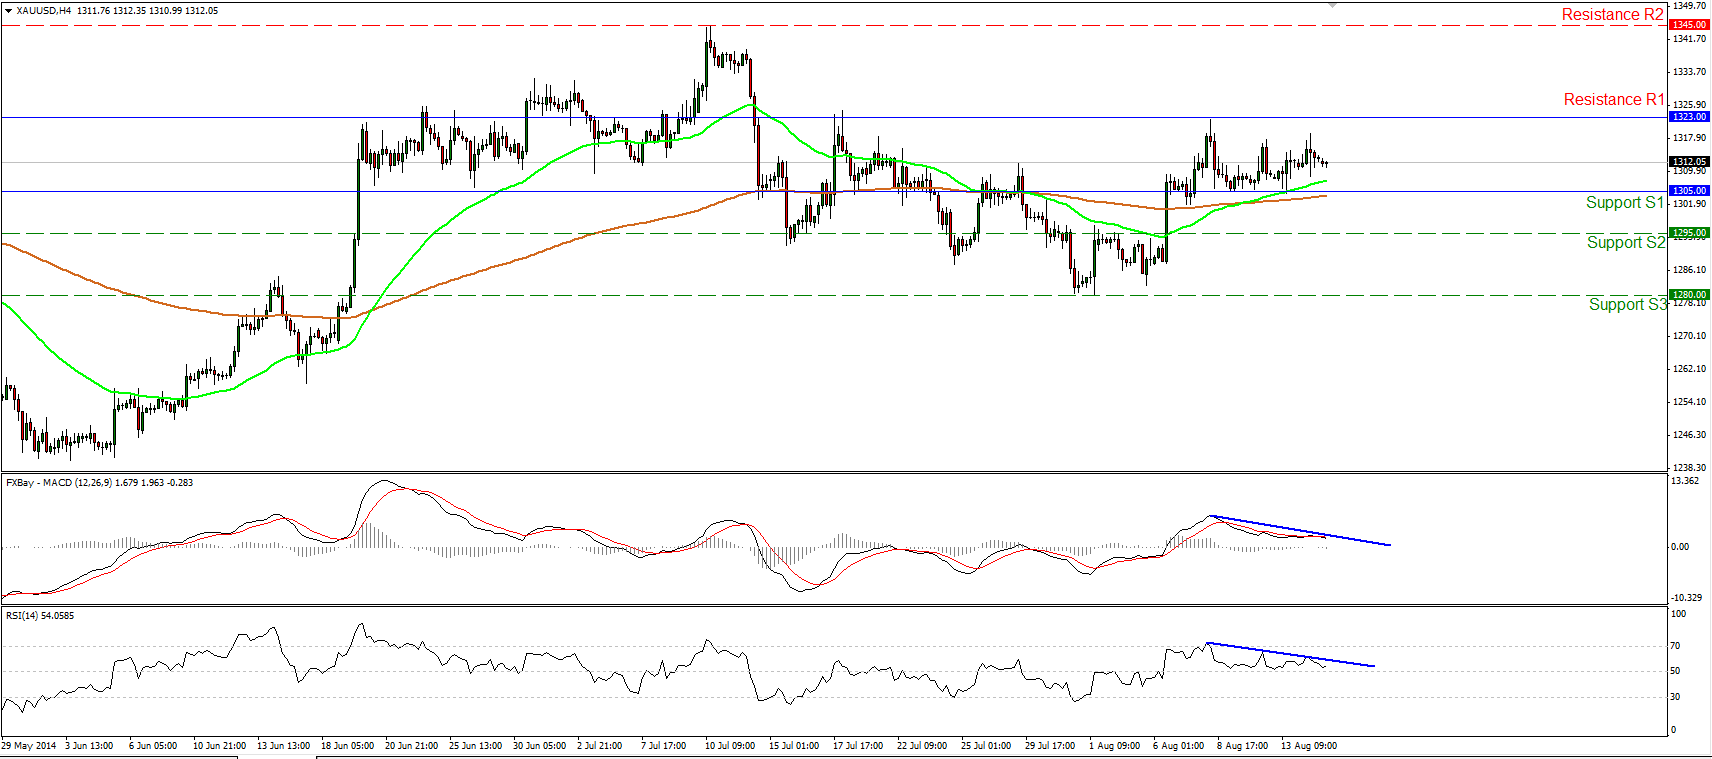
Gold remained where we left it yesterday, within the range between the support of 1305 (S1) and the resistance of 1323 (R1). On the 4-hour chart, both our momentum indicators are still within their positive territories, but they both follow downside paths. Moreover, on the daily chart, both the 50- and 200-day moving averages are still pointing sideways, while the daily oscillators are sitting near their neutral lines, keeping the overall path sideways. As a result, I would stay to the sidelines until we start seeing a clear trending technical picture. A dip below 1305 (S1) is likely to find support at 1295 (S2), while a move above 1323 (R1) could target the highs of the 10th of July, at 1345 (R2)
• Support: 1305 (S1), 1295 (S2), 1280 (S3)
• Resistance: 1323 (R1), 1345 (R2), 1355 (R3)
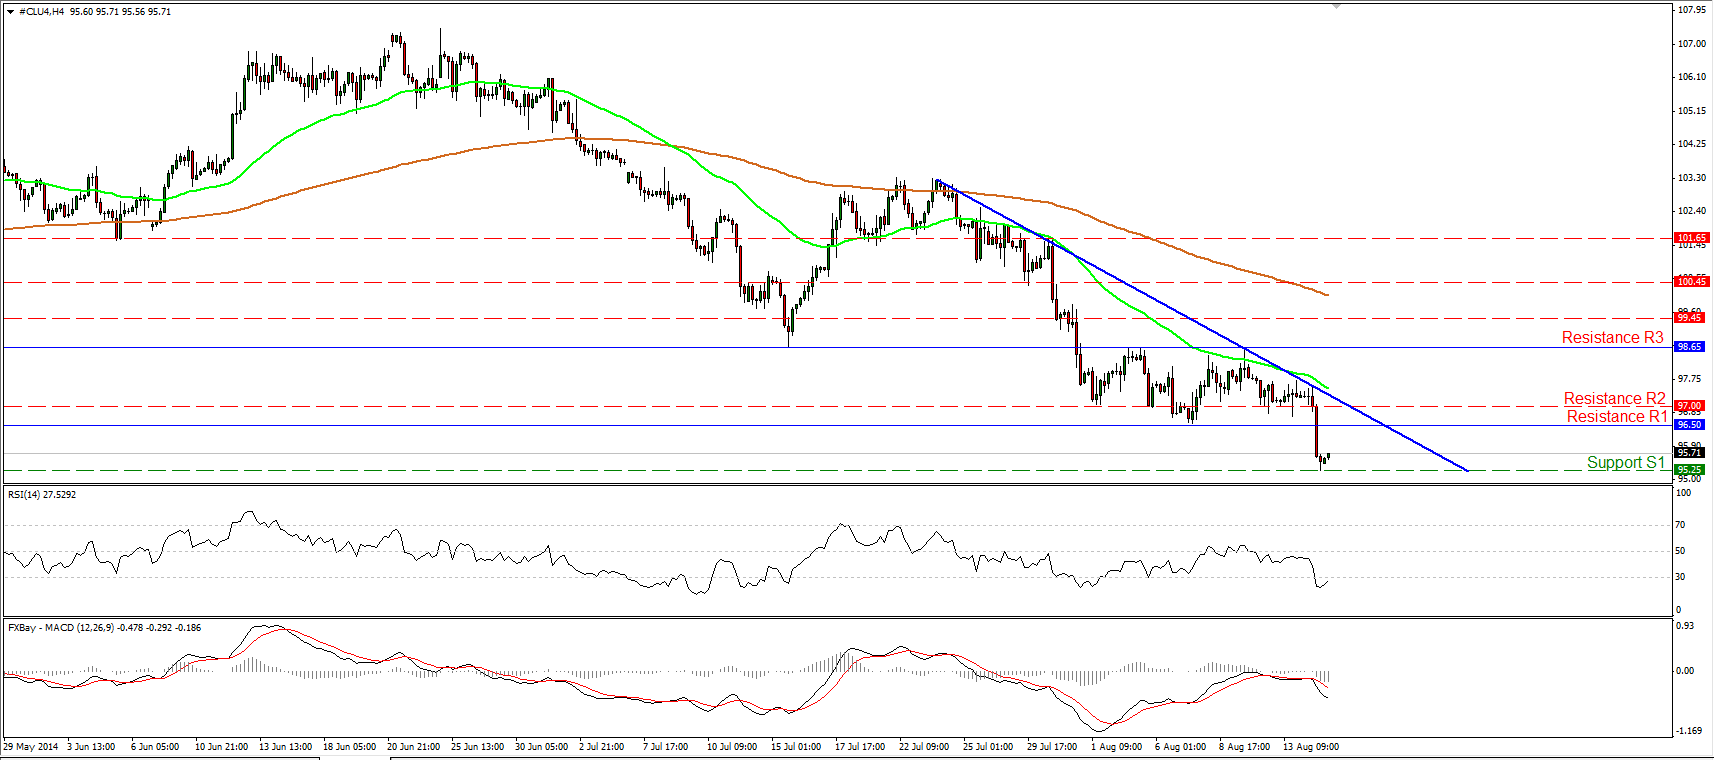
WTI breaks below 96.50
WTI tumbled on Thursday, breaking below 96.50 the lower bound of the recent sideways range it's been trading since the 31st of July. The decline was halted at 95.25 (S1) and taking into account our momentum signs, I would expect the forthcoming wave to be to the upside, perhaps to test the 96.50/97.00 zone as a resistance this time. Zooming on the 1-hour chart, the 14-hour RSI exited its oversold field and is now pointing up, while the hourly MACD, although negative, seems willing to move above its signal line. The dip below 96.50 (R1) turned the outlook back to the downside, thus I would consider any future upside moves below the blue downtrend line as a correcting phase before sellers take control again.
• Support: 95.25 (S1), 93.65 (S2), 91.60 (S3)
• Resistance: 96.50 (R1), 97.00 (R2), 98.65 (R3)

