Get 40% Off
🚨 Volatile Markets? Find Hidden Gems for Serious OutperformanceFind Stocks Now

EUR/NZD On It's Way To September 2018 Highs?

Published 08/03/2019, 11:37 AM
Updated 07/09/2023, 06:32 AM

Is EUR/NZD on it's way to the September 2018 highs, located within the 1.78000 / 1.80000 resistance zone?

Recently we have been monitoring EUR/NZD on the daily time frame and its movement since bottoming out at around 1.65330 midway throughout July.

Since then we have noticed a strong rebound which has pushed the price through the 50, 100 and 200 Smoothed Moving Averages and is beginning to confirm a Golden Cross on the daily time frame.

As of writing this article the current price is 1.69860 whilst the market is closed for the weekend, with further upside looking likely to take the price towards the area of resistance at the 1.72000 region. We will probably see a pullback at these levels whilst we convert the resistance zone into a support zone allowing the bullish momentum to recover strength.

Once support has been established at the 1.72000 region, the pathway could then be unlocked for a further test of the 1.75000 psychological resistance area; which was last reached towards the end of 2018. We are confident that these levels can be held quite easily as the price will be comfortably above the three main Smoothed Moving Averages that we have mentioned above.

In the event that we surpass the 1.75000 region, the likelyhood of hitting the 2018 highs, located at the 1.78000 / 1.80000 area, are regarded as quite high. This is due to the limited amount of resistance that is present between these levels allowing plenty of opportunity for the price to squeeze higher and test such levels.

3rd party Ad. Not an offer or recommendation by Investing.com. See disclosure here or remove ads .

To invalidate the above analysis, we will need to see a clear rejection at one of the levels highlighted, aswell as preferrably seeing the price drop back below the Smoothed Moving Averages on the daily timeframes to then confirm a bearish trend.
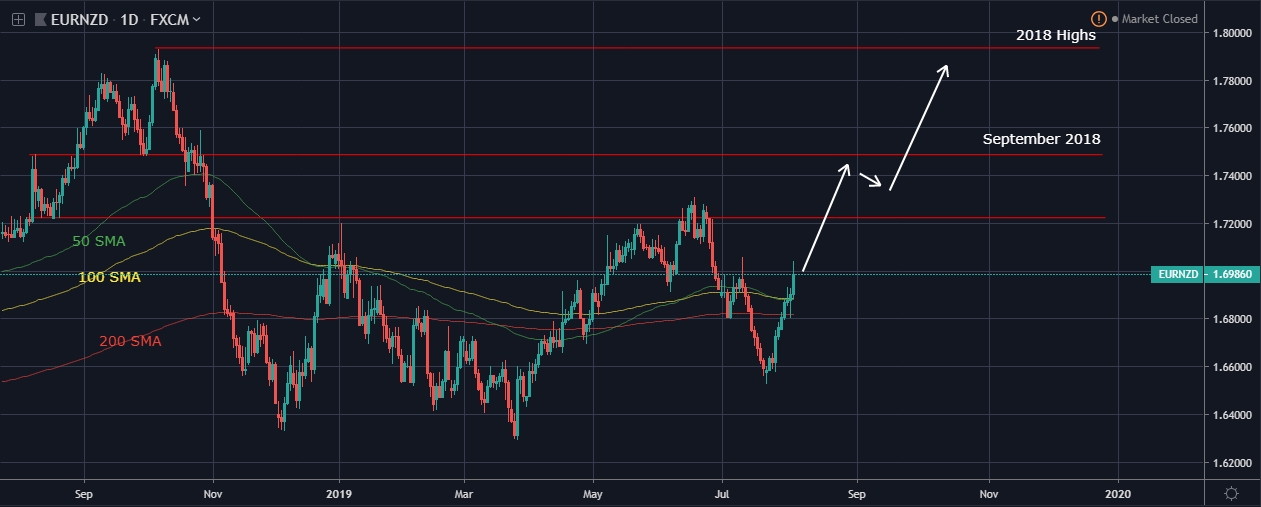
EUR/NZD Daily Chart Analysis

Latest comments

Risk Disclosure: Trading in financial instruments and/or cryptocurrencies involves high risks including the risk of losing some, or all, of your investment amount, and may not be suitable for all investors. Prices of cryptocurrencies are extremely volatile and may be affected by external factors such as financial, regulatory or political events. Trading on margin increases the financial risks.
Before deciding to trade in financial instrument or cryptocurrencies you should be fully informed of the risks and costs associated with trading the financial markets, carefully consider your investment objectives, level of experience, and risk appetite, and seek professional advice where needed.
Fusion Media would like to remind you that the data contained in this website is not necessarily real-time nor accurate. The data and prices on the website are not necessarily provided by any market or exchange, but may be provided by market makers, and so prices may not be accurate and may differ from the actual price at any given market, meaning prices are indicative and not appropriate for trading purposes. Fusion Media and any provider of the data contained in this website will not accept liability for any loss or damage as a result of your trading, or your reliance on the information contained within this website.
It is prohibited to use, store, reproduce, display, modify, transmit or distribute the data contained in this website without the explicit prior written permission of Fusion Media and/or the data provider. All intellectual property rights are reserved by the providers and/or the exchange providing the data contained in this website.
Fusion Media may be compensated by the advertisers that appear on the website, based on your interaction with the advertisements or advertisers.
© 2007-2024 - Fusion Media Limited. All Rights Reserved.