
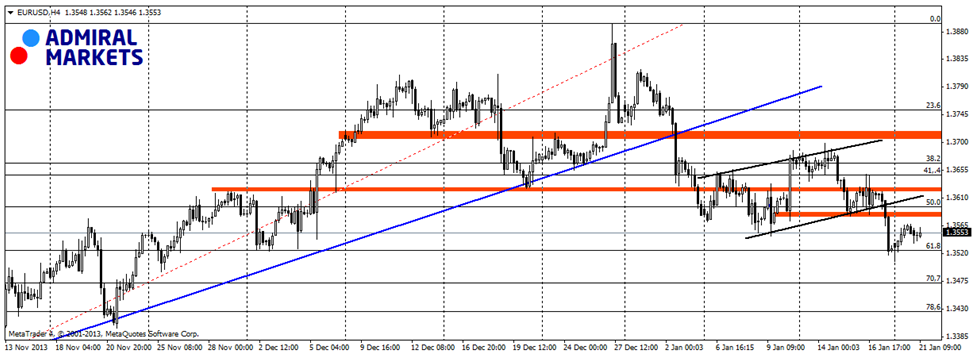
Yesterday, with the absence of American traders, brought us a movement mostly influenced by the technical bounce from the 61.8 Fibonacci level, and the hammer shaped candle which was drawn there. The closest resistance is at 1.3585 and the 50% retracement slightly above. Even with yesterday’s bounce, it is still less probable that price will break this level. The reason for this is the fact that we are influenced by the bigger and more important technical signals. The first one was the uptrend line breakout from the 2nd of January and the second one was a bearish breakout from the flag formation on the 17th of January. The closest support is at 61.8 Fibonacci and we can assume that breaking this level can give bears momentum to drive prices lower, and in the mid-term, reach the lows from the beginning of November. The calendar today is also empty, but in the morning, we will find out one important figure from the biggest economy in the EU: German ZEW Economic Sentiment.
 EUR/USD 4 Hour Chart" title="EUR/USD 4 Hour Chart" width="474" height="242">