
Main scenario:
The pair is trading along an downtrend.
The downtrend may be expected to continue while pair is trading below resistance level 1.6165, which will be followed by reaching support level 1.5945.
Alternative scenario:
An uptrend will start as soon, as the pair rises above resistance level 1.6165, which will be followed by moving up to resistance level 1.6235.
Support and Resistance levels:
Supports: 1.6000, 1.5945 (strong)
Resistances: 1.6090, 1.6165 (main), 1.6235, 1.6300 (strong)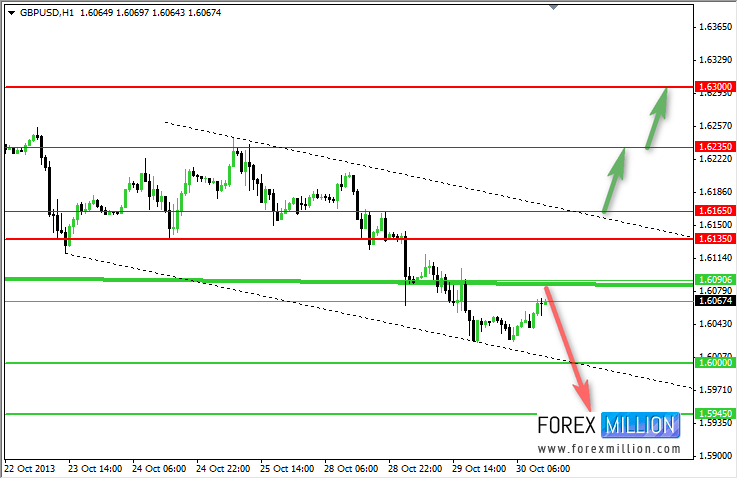 GBP/USD Hour Chart" title="GBP/USD Hour Chart" width="739" height="480">
Previous forecast: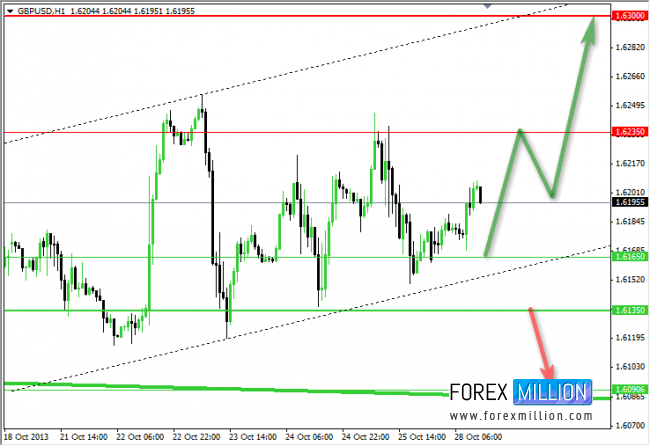 GBP/USD Hour Chart" title="GBP/USD Hour Chart" width="739" height="480">
Weekly Forecast: 28 October - 01 November
Main scenario:
The pair is trading along an uptrend.
The uptrend may be expected to continue while pair is trading above support level 1.6135, which will be followed by reaching resistance level 1.6300 and if it keeps on moving up above that level, we may expect the pair to reach resistancet level 1.6470.
Alternative scenario:
A downtrend will start as soon, as the pair drops below support level 1.6135, which will be followed by moving down to support level 1.6000 - 1.5945.
Support and Resistance levels:
Supports: 1.6165, 1.6135 (main), 1.6000 - 1.5945
Resistances: 1.6235, 1.6300 (strong), 1.6470 (strong)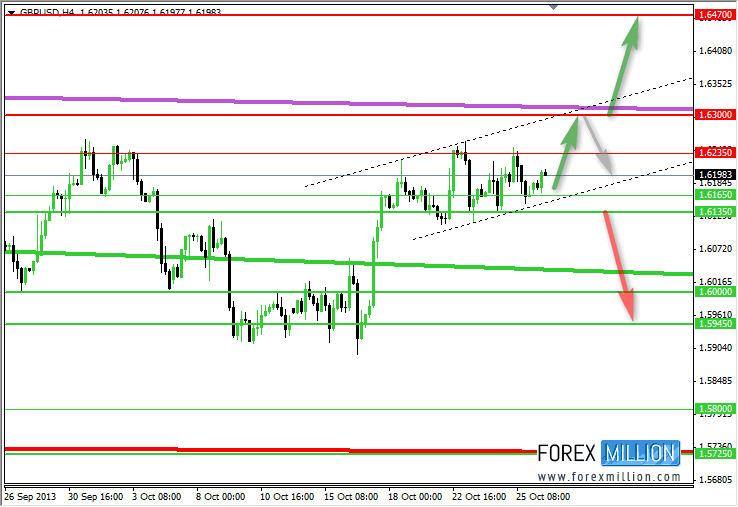 GBP/USD Hourly Chart" title="GBP/USD Hourly Chart" width="739" height="480">
Previous forecast: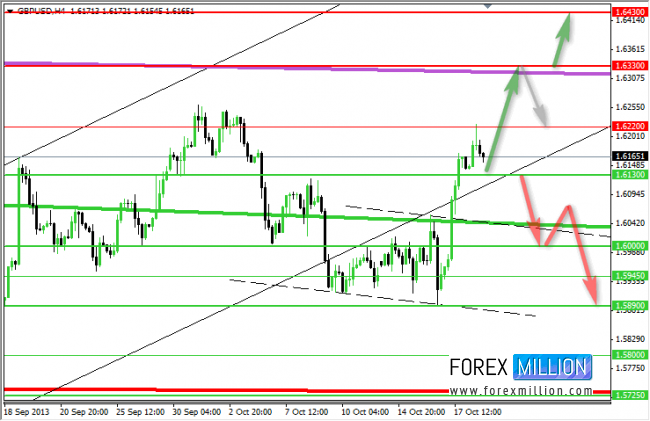 GBP/USD Hourly Chart" title="GBP/USD Hourly Chart" width="739" height="480">
Monthly forecast: October - November
Main scenario:
Market continue uptrend development. On the level 1.6000 was formed strong support level and while gbpusd is trading above it, we can expect uptrend continuation with target on strong resistance level 1.6700, where on the levels 1.6330 - 1.6430 we will have intermediate resistance, that give some correction on the market..
Alternative scenario:
Downtrend will start if pair will drops below support level 1.6000, which will be followed by moving down to support level 1.5725 and then 1.5530.
Support and Resistance levels:
Supports: 1.6000 (main), 1.5725 (strong), 1.5530 (strong)
Resistances: 1.6430 (intermediate), 1.6700 (main)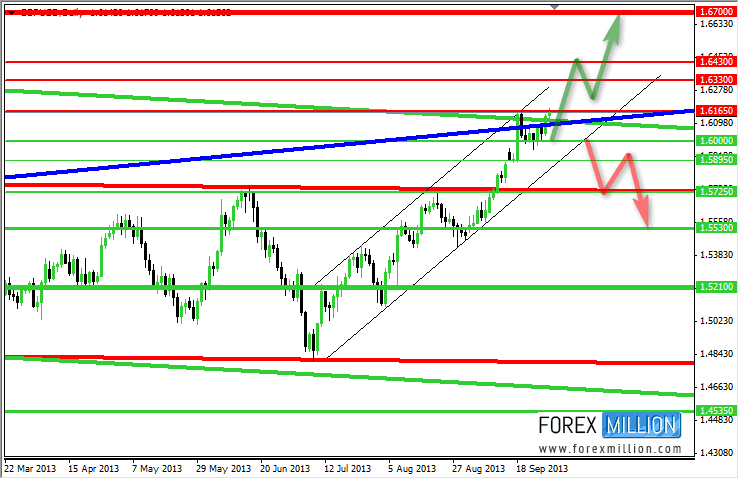 GBP/USD Daily Chart" title="GBP/USD Daily Chart" width="739" height="480">
Long-term Forecast and Analysis: October, Novemder, December, January
Main scenario:
Market is going to break upper boundary of pink downtrend, that is goes though the level 1.6165, that now randing resistance on the market. But wave analysis showing that this resistance will be intermediate and soon gbpusd will reach main resistance level 1.6700, where also we will have intermediate resistance level on 1.6330 - 1.6430.
Alternative scenario:
On the level 1.6000 was formed strong support level, with a breakdown of which pair will confirm rebounding from resistance level 1.6165 and will start downtrend on the main support level 1.5530, here intermediate support we will have on the 1.5725.
Support and Resistance levels:
Supports: 1.6000 (main), 1.5725 (strong), 1.5530 (main)
Resistances: 1.6165 (intermediate), 1.6430 (strong), 1.6700 (main)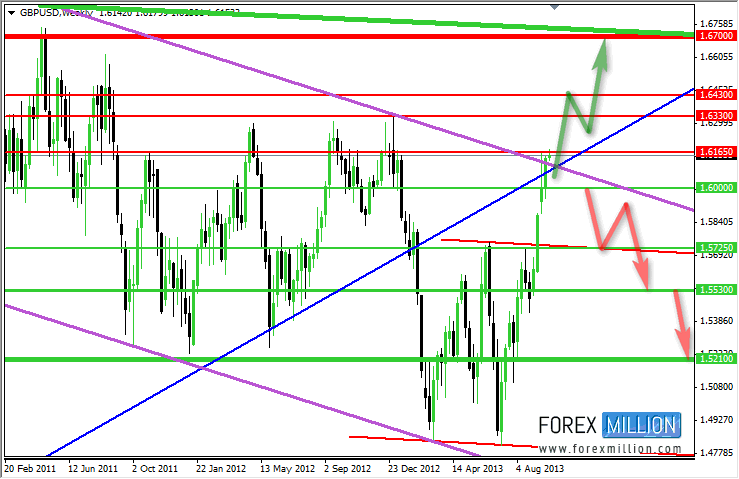 GBP/USD Weekly Chart" title="GBP/USD Weekly Chart" width="739" height="480">