Risk aversion resumed after the US returned from its holiday, with investor sentiment turning sour after a third real estate fund suspended trading after an increase in investor redemptions. Sterling slumped as expected, fueled by the BoE lowering capital buffer requirements. Today's main catalyst will be the FOMC meeting minutes.
EUR/USD Daily Analysis

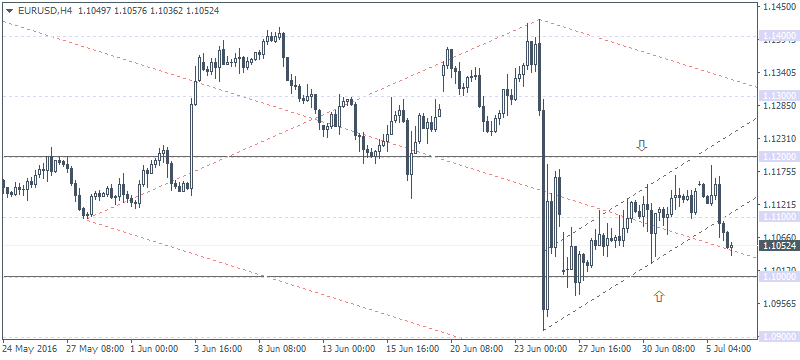
EUR/USD (1.105): The single currency was bearish yesterday, closing in a bearish engulfing pattern. With prices breaking below 1.110, further downside is expected on a confirmation of price action falling below 1.10, unless we see a reversal back above 1.10.
The dollar has resumed its strength and it is quite likely that further downside can be expected in EURUSD as a result. Watch for EUR/USD to decline to 1.09 if the 1.10 support fails to hold the declines.
The bearish view is seen being validated on the 4-hour chart where EUR/USD is seen breaking out strongly from the bearish flat pattern, with further downside on a break below 1.10. Look for short-term retracements to 1.110 of the current 1.105 or 1.10, alternatively a bearish close of 1.10.
USD/JPY Daily Analysis

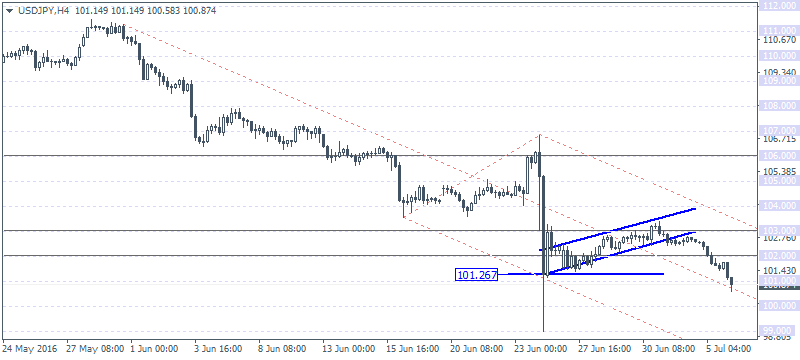
USD/JPY (100.87): USD/JPY closed down below 102 support yesterday with prices extending lower. Next major support is at 100, which makes for a strong psychological level. The daily Stochastics is still forming a bullish divergence, and as noted in yesterday's commentary the potential bullish divergence could see price post a correction in the near term.
On the 4-hour chart, USD/JPY is still making a higher low compared to the June 23 lows of 99.01. To the upside, 102 remains a key resistance level, with further upside likely only on a break above this level.
GBP/USD Daily Analysis

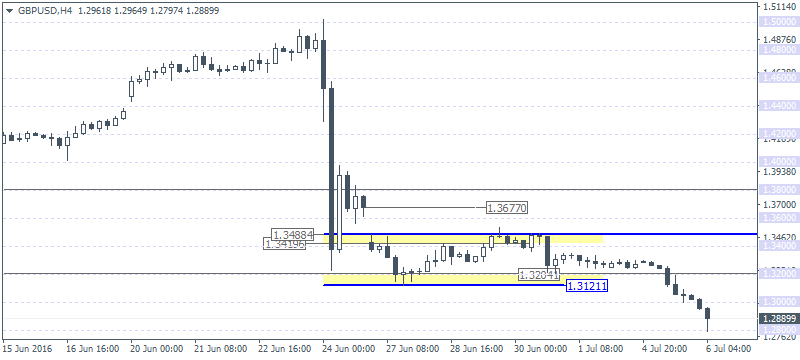
GBP/USD (1.288): GBP/USD broke out of its range to the downside at 1.320 and promptly extended its decline below 1.30, with prices seen testing the lows of 1.28 earlier today. On the 4-hour chart, the downside breakout has validated the bear flag pattern confirming further downside.
However, watch the bullish divergence on the Stochastics, which could offer a modest bounce back to 1.3121 - 1.320 which previously acted as support. A retest of resistance here will confirm more downside in GBP/USD.
Gold Daily Analysis

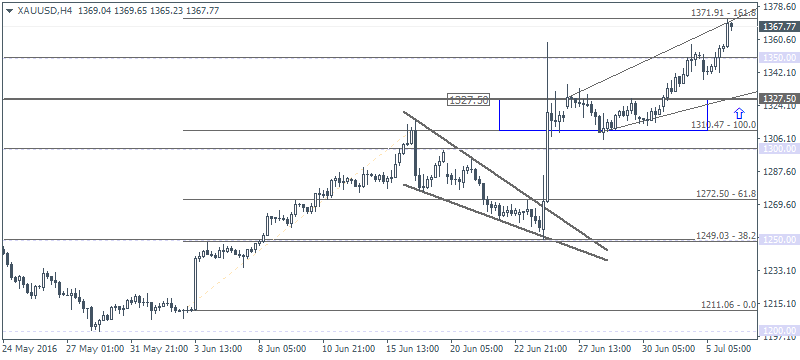
XAU/USD (1367.67): Gold prices broke out to the upside above 1350 yesterday, with early price action this morning seeing a test of 1371. There is a strong median line resistance at the current levels which could keep gold consolidated in the near term. On the 4-hour chart, 1371.91 target is likely to be achieved, but a close above this level would confirm the view. So far we only had a brief test to this level.
Overall, gold looks to have completed its bullish extension following the bullish pennant breakout and a resulting retest back to 1310. We also notice a potential broadening funnel pattern forming which could see a downside back to 1327.50 following a bearish reversal near 1371 - 1375 region.
