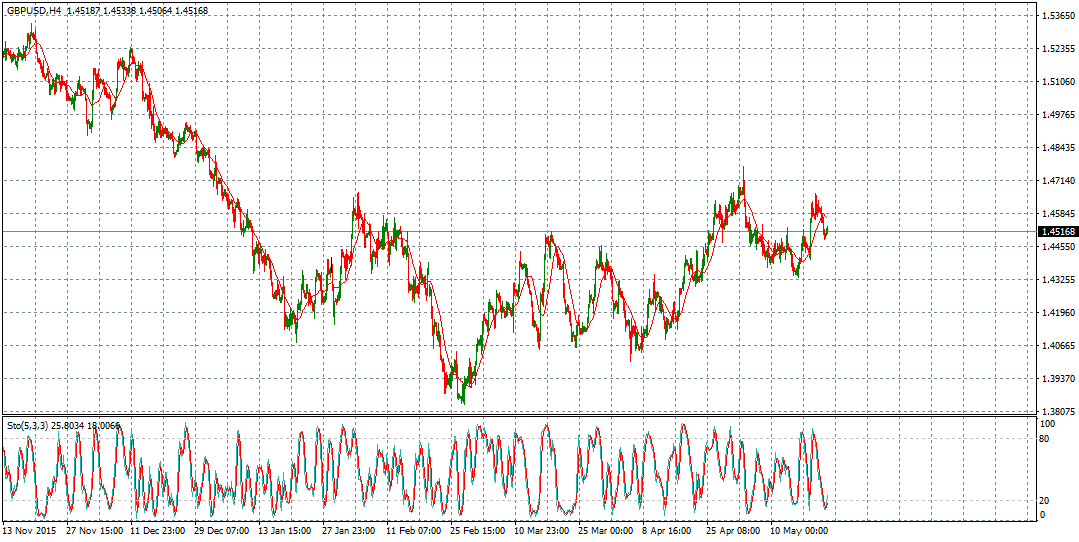
GBP/USD
The GBP/USD pair traded with clear negativity in last Friday to settle at near the EMA50, and the price begins attempts for a bullish rebound after it found a good support that formed by the intraday bullish trend line that appears in the image, reinforced by stochastic positivity that appears clearly on the four hours time frame.
Therefore, we believe that the chances available for resuming the bullish trend in the upcoming sessions, and the main target located at 1.4820, being aware that breaking 1.4485 level will stop the positive expectations and pushes the price to test 1.4215 level before any new attempt to rise.
Expected trading range for today is between 1.4450 support and 1.4670 resistance.
Expected trend for today: Bullish
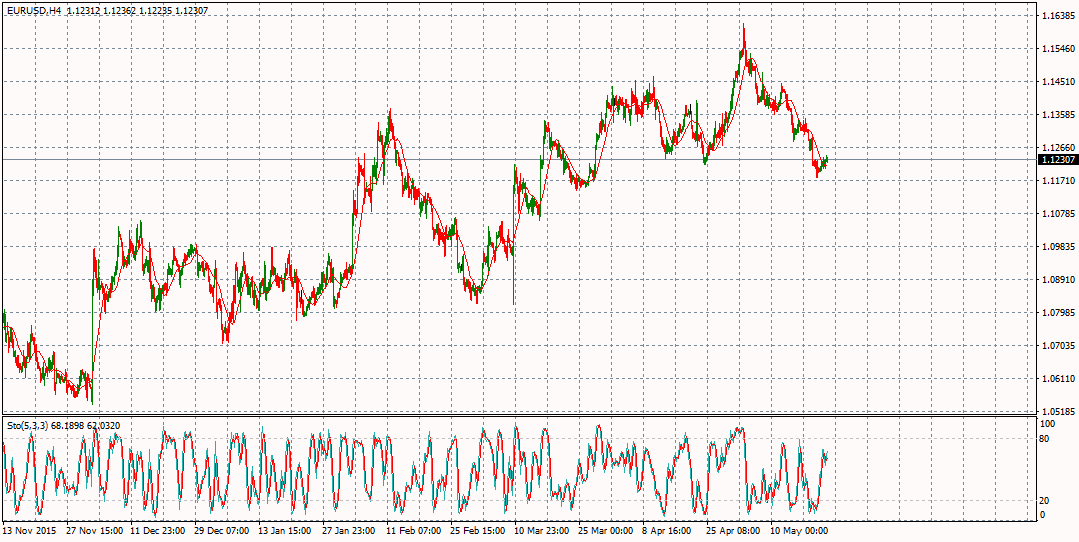
EUR/USD
The EUR/USD pair faces a strong support base at 1.1196 level, where the price shows some slight positive trading to move near 1.1230, noticing that the EMA50 keeps pushing negatively on the price, while stochastic moves at the overbought levels.
Therefore, we will keep preferring the bearish trend in the upcoming period unless breaching 1.1356 level and holding above it, pointing that breaking 1.1196 level will confirm opening the way towards 1.1066 as a next main target.
Expected trading range for today is between 1.1100 support and 1.1300 resistance.
Expected trend for today: Bearish
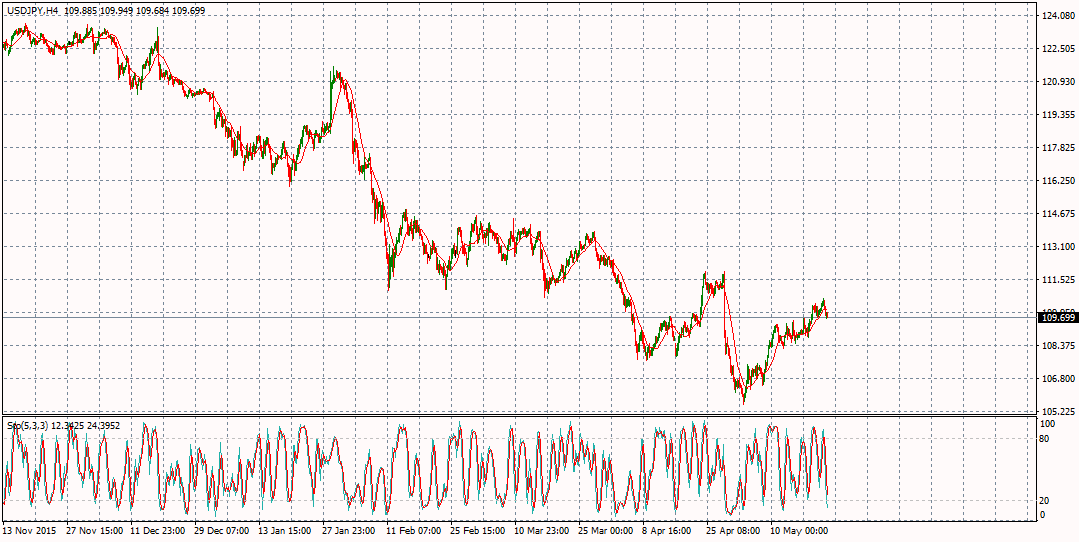
USD/JPY
The USD/JPY pair continues the attempts of surpassing the EMA50 that forms a strong resistance at 110.20, where the price needs this breach to confirm the extension of the current bullish wave to 113.97, pointing that stochastic current negativity explains the reasons for the last sideways fluctuation.
In general, we keep preferring the bullish trend in the upcoming period unless breaking 106.63 level, which will put the price under the bearish correctional pressure again to extend the bearish wave to 100.70.
Expected trading range for today is between 109.00 support and 111.50 resistance.
Expected trend for today: Bullish
Oil
Crude oil price shows some slight bearish bias to move below 48.40 level now, but it managed to close last week’s candlestick above this level, which keeps the bullish trend scenario valid and active for the upcoming period, supported by stochastic reach to the oversold areas now, besides the positive support provided by the EMA50.
Therefore, we are waiting to resume the bullish wave that its next target located at 51.10, taking into consideration that breaking 47.25 level will complete forming a bearish pattern that has the ability to turn the intraday trading to decline to visit the main bullish channel’s support around 44.40 before any new attempt to rise.
Expected trading range for today is between 46.50 support and 51.10 resistance.
Expected trend for today: Bullish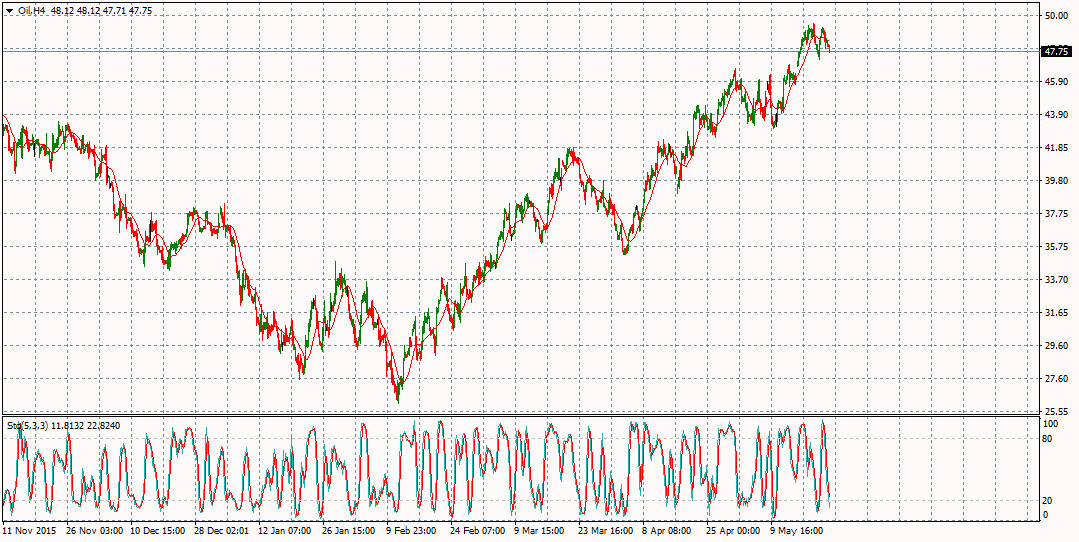
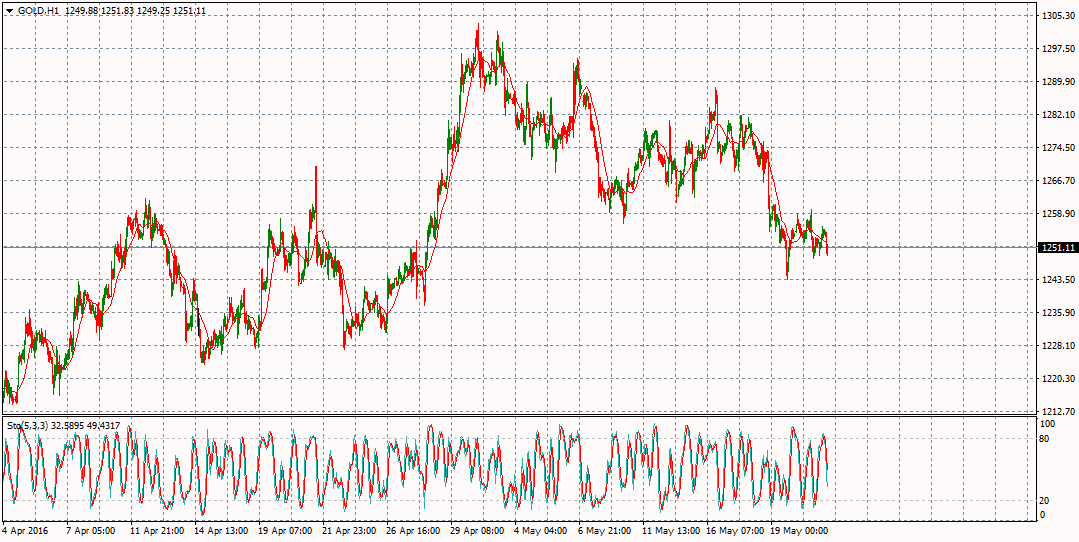
Gold
Gold price keeps its stability above 1243.17 level, while stochastic begins to offer positive overlapping signal on the four hours’ time frame, which forms positive motive that we are waiting to assist to push the price to resume the bullish in the upcoming sessions, and the positive targets will begin at 1274.70 followed by 1303.58.
Therefore, the bullish trend will remain suggested on the intraday and short term basis, and breaching the last level will extend gold price gains to reach 1344.85, taking into consideration that breaking 1243.17 level will push the price to extend its bearish correction to reach towards 1205.80 as a next main station.
Expected trading range for today is between 1240.00 support and 1280.00 resistance.

