Get 40% Off
🚨 Volatile Markets? Find Hidden Gems for Serious OutperformanceFind Stocks Now

EUR/USD, USD/JPY, GBP/USD, S&P 500: Intraday Outlooks

Published 08/21/2014, 05:48 AM
Updated 07/09/2023, 06:31 AM

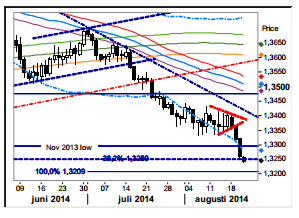
EUR/USD: In the middle of the support zone

The passage of 1.3295 (Nov 2013 low) paved the way for lower prices and the pair soon arrived at 1.3250, the 38.2% Fibo support of the entire 2012/14 advance and the theoretical target for the triangle. As triangles normally are occurring very late in trending moves the risk of a reversal following a triangle breakout is high so we think it is time to start looking for correctional signs from 1.3250 and downwards.

EUR/USD Daily Chart

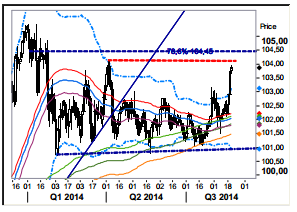
USD/JPY: 104.13 resistance to be scrutinized

The latest development does not fit well with our longer term wave pattern (a sub 100 correction) and if breaking 104.13 it must be adjusted. An alternate path would be that we are creating yet another large triangle (hence a major top still lurking) and as such the market should turn down from 104.45, slide back to 103-ish and thereafter printing a new trend high above 105.45.

USD/JPY Daily Chart

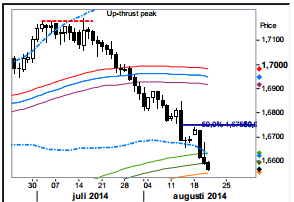
GBP/USD: An utterly bearish behavior

The post BOE minutes bounce was soon reversed leaving us with a long upper spike. The behavior is very bearish and supporting our view of a soon to come break of the 233d ma band, an event that also will confirm that more (and probably considerable) losses are underway. As pointed at yesterday such a break will next target 1.6380 and 1.60-ish (2009 top line).

GBP/USD Daily Chart

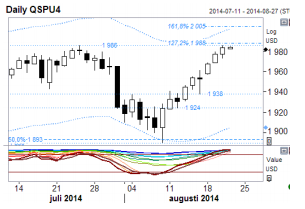
S&P 500: FOMC hurt, but not that much

The initial reaction to the FOMC minutes was negative, but by the close the hurt was healed – and more. Short-term multi-stochastics are back into an overstretched, but the deviation from a 21day exponential moving average is not extreme, so given price action of late at least a probe above the Jul high of 1,986 looks likely. In such a scenario a short-term 161.8% Fibo projection ref works as an attraction/resistance within reach.

3rd party Ad. Not an offer or recommendation by Investing.com. See disclosure here or remove ads .

S&P 500 Chart

Latest comments

Risk Disclosure: Trading in financial instruments and/or cryptocurrencies involves high risks including the risk of losing some, or all, of your investment amount, and may not be suitable for all investors. Prices of cryptocurrencies are extremely volatile and may be affected by external factors such as financial, regulatory or political events. Trading on margin increases the financial risks.
Before deciding to trade in financial instrument or cryptocurrencies you should be fully informed of the risks and costs associated with trading the financial markets, carefully consider your investment objectives, level of experience, and risk appetite, and seek professional advice where needed.
Fusion Media would like to remind you that the data contained in this website is not necessarily real-time nor accurate. The data and prices on the website are not necessarily provided by any market or exchange, but may be provided by market makers, and so prices may not be accurate and may differ from the actual price at any given market, meaning prices are indicative and not appropriate for trading purposes. Fusion Media and any provider of the data contained in this website will not accept liability for any loss or damage as a result of your trading, or your reliance on the information contained within this website.
It is prohibited to use, store, reproduce, display, modify, transmit or distribute the data contained in this website without the explicit prior written permission of Fusion Media and/or the data provider. All intellectual property rights are reserved by the providers and/or the exchange providing the data contained in this website.
Fusion Media may be compensated by the advertisers that appear on the website, based on your interaction with the advertisements or advertisers.
© 2007-2024 - Fusion Media Limited. All Rights Reserved.