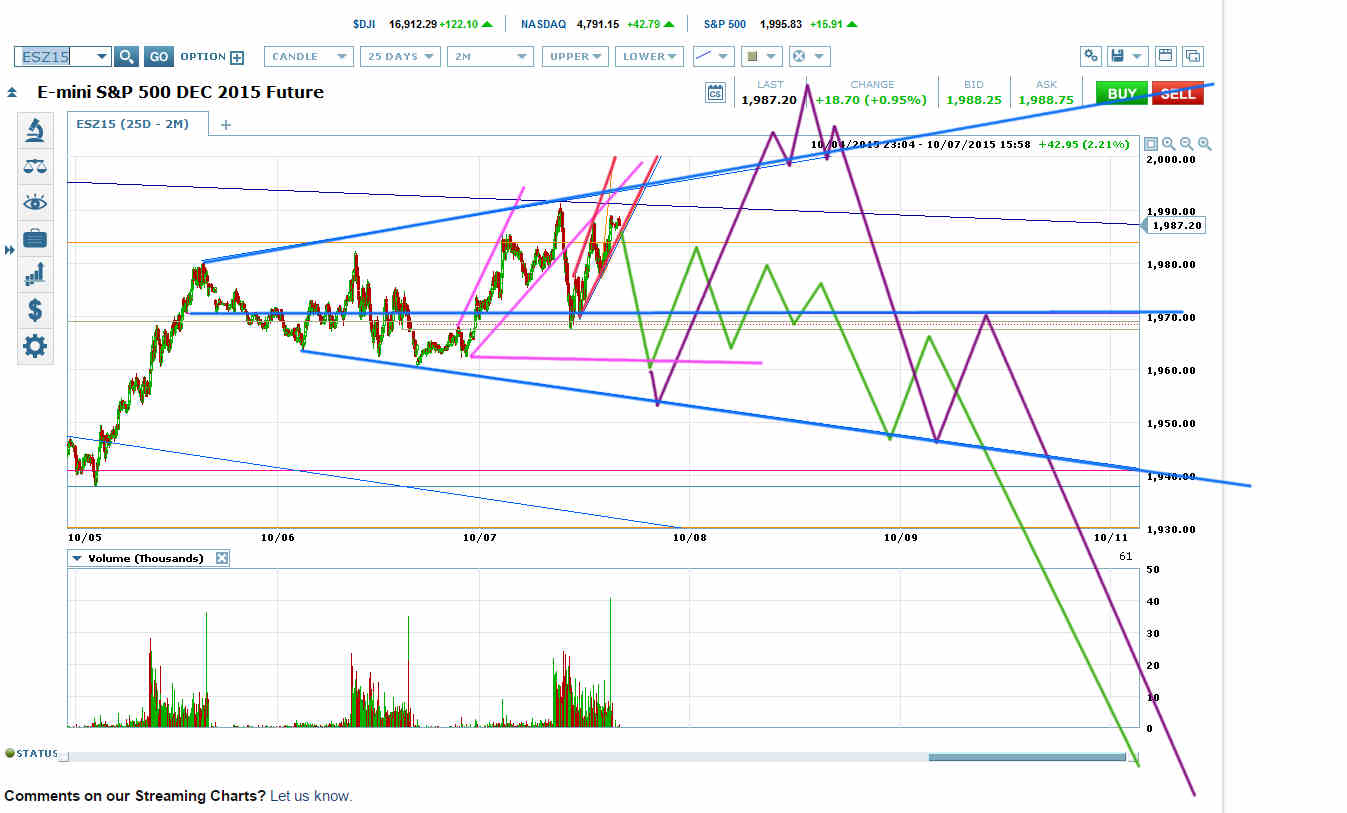
Rising Megaphone Short Squeeze

ES Topping Scenarios
ES put in two rising megaphones today (pink and red on chart) within the blue topping megaphone.
The retrace target for the pink rising megaphone is roughly 1962. Because ES broke out of the pink rising megaphone and hasn’t reached 1962 yet, the red rising megaphone is likely a connecting wave en route to 1962.
Head and Shoulders vs. Megaphone Top
ES can go past 1962 to the blue megaphone bottom, or it can reverse at 1962 to put a right shoulder on the potential H&S on the chart. If it goes for the H&S, it’s likely to put in a triangle right shoulder before a downwards breakout (green scenario).
If ES goes for the blue megaphone bottom, it’s got an excellent chance of one final killer melt-up wave up to the megaphone top (purple scenario). That wave would break through the top and put a topping formation up there with a neckline at the blue megaphone top. If you feel that final melt-up will unhinge you, get out on the retrace to 1962.
Potential Falling Megaphone to Take Out August 24 Low
The blue megaphone has formed across the top of a potential falling megaphone on the ES 60-minute chart. That means it’s an overwhelming favorite to break out downwards back into the falling megaphone to complete the formation by taking out the August 24 low. The NYMO -100 close on August 24 would almost always be followed by a lower price low, so this formation is even more likely to complete.
Heading Into Opex Week with a Collapsed SPY Put-Call Ratio
We are now heading into the Thursday before opex week. If ES completes the purple scenario, I can tell you that the SPDR S&P 500 (NYSE:SPY) put-call ratio will collapse (it may have already collapsed). A collapsed SPY put-call ratio heading into opex week would be a strong set-up for a bearish price move.
Target
If the blue topping megaphone breaks out downwards, it will be putting a top on the right shoulder of an H&S that targets 1711. A trip to 1711 would confirm a bear market.
I don’t know if the market will make it to 1711 to confirm a bear market. But I do know that ES is a terrific favorite to take out the August 24 low, and that once it does, wherever it bottoms, we’ll have a terrific set-up to go long.
If the Blue Megaphone Breaks Out Upwards
In the unlikely event that the blue megaphone breaks out upwards, the target is roughly 2050 before ES reverses to take out the August 24 low. Again, get out at 1962 if you feel you couldn’t handle that move, then short on either the downwards breakout from the blue megaphone or whatever topping pattern shows up at 2050.
Chill People
These tops tend to take forever. After a melt-up, people don’t turn bearish on a dime. It’s a process.
