Economic earnings represent the true earnings for shareholders and are very different from accounting earnings. GAAP accounting data was not originally designed for equity investors, but for debt investors.
To derive economic earnings, 30+ adjustments must be made to accounting earnings. These adjustments remove items hidden in the footnotes and MD&A of annual filings and close loopholes within GAAP accounting.
The formulae for economic earnings are in Figure 1.
Figure 1: How To Calculate Economic Earnings
NOPAT – WACC * Invested Capital
Or
(ROIC – WACC) * Invested Capital
Sources: New Constructs, LLC and company filings
Economic earnings are better than accounting earnings because
- They are based on the complete set of financial information available
- They are normalized for all companies
- They are a more accurate representation of the true underlying cash flows of business.
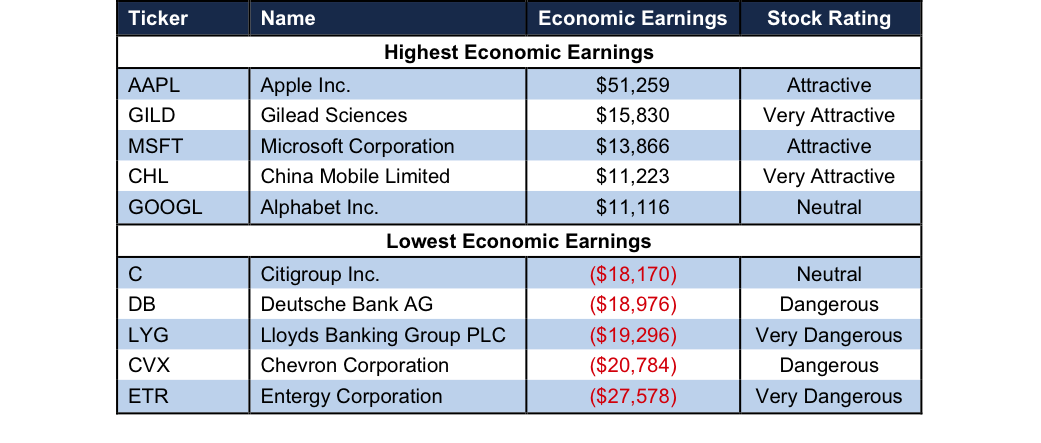
If a company is not generating positive economic earnings, it is not creating shareholder value. Figure 2 shows which companies are creating and destroying the most value.
Figure 2: Companies With Highest/Lowest Economic Earnings

Sources: New Constructs, LLC and company filings.
Out of 3000+ companies, Apple (NASDAQ:AAPL) earns the largest economic earnings at over $51 billion. See Apple’s historical economic earnings dating back to 1998 here. Apple has earned positive economic earnings every year dating back to 2004. Gilead Sciences (NASDAQ:GILD), Microsoft Corporation (NASDAQ:MSFT), China Mobile Ltd (NYSE:CHL), and Alphabet Inc (NASDAQ:GOOGL) each generate some of the highest economic earnings of all companies under coverage. In order to be as transparent as possible, we provide a reconciliation of GAAP net income to economic earnings in each of our company models. Investors only stand to benefit from increased transparency, which is why our calculations are made available in each company model. The reconciliation of Gilead’s GAAP net income to economic earnings can be found here.
Entergy Corporation (NYSE:ETR) generates the lowest, or most negative economic earnings of all companies under coverage. See Entergy’s historical economic earnings dating back to 1998 in our model here. As can be seen in our model, Entergy has failed to generate positive economic earnings in any year of our model. The company has consistently increased its invested capital while not generating a subsequent increase in profits, thereby destroying shareholder value in the process. Citigroup (NYSE:C), Deutsche Bank AG (DE:DBKGn) NA O.N. (NYSE:DB), Lloyds Banking (LON:LLOY) Group PLC (NYSE:LYG), and Chevron Corporation (NYSE:CVX) round out the top five companies with the lowest economic earnings.
Our models and calculations are 100% transparent because we want our clients to know how much work we do to ensure we give them the best earnings quality and valuation models in the business.
Disclosure: David Trainer and Kyle Guske II receive no compensation to write about any specific stock, sector, style, or theme.
