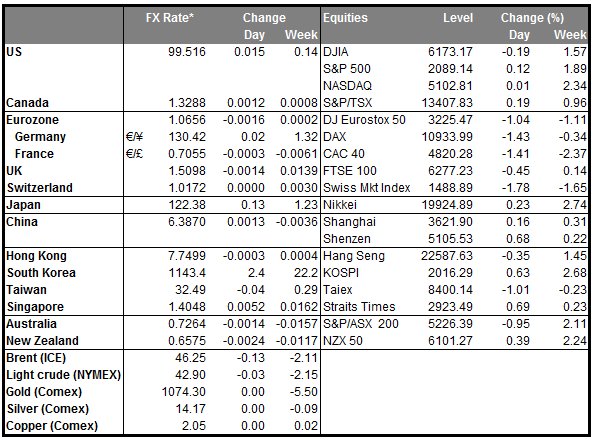
• ECB to unleash fresh stimulus All eyes will be on the ECB policy meeting in what is probably the most highly anticipated Bank meeting after the US Fed gathering in mid-December. The market is already pricing in a 10bps deposit rate cut, with some participants -including us- calling for an even more aggressive 20bps reduction. An increase in the size of the Bank’s monthly purchases, as well as an extension in the duration of the program is thought to be a closed deal. As such, the Bank will have to deliver measures over and above current market expectations to avoid an upward movement in the euro, in our view. In the last few weeks, ECB President Mario Draghi and several Bank officials essentially pre-committed for another rate cut and an increase of the current stimulus package. Anything less than current expectations could disappoint investors and we could see the common currency strengthening. We should bear in mind however the well-known rhetoric of ECB’s Draghi to do whatever it takes to support Eurozone’s economy and by that, he could always surprise the markets and bring EUR/USD closer to parity.
• Fed Chair Yellen is confident in the outlook for the economy Fed Chair Janet Yellen said that she is confident in the outlook for economic growth and warned that waiting too long to start the policy normalization process could lead the Fed to tighten too quickly. Such an abrupt tightening she said, would risk disrupting financial markets and perhaps even inadvertently push the economy into recession. This was the latest sign that the Fed is poised to raise rates at their meeting in few weeks. Chair Yellen testifies today before the Congress’ Joint Economic Committee, and she is probably going to discuss again her view on the current economic situation along with monetary policy ahead of the crucial FOMC meeting. We expect that while she may leave expectations of the rate increase in place as she did on Wednesday, the focus will shift on the pace of the hikes that will follow.
• Today’s highlights: As for indicators, we get the final service-sector PMIs for November from the countries we got the manufacturing data on Tuesday. The final forecasts for France, Germany and Eurozone are the same as the initial estimates, so no major market reaction is expected. The UK service-sector PMI for November is forecast to have risen somewhat. Having in mind the negative surprises in the manufacturing index on Tuesday and the construction PMI on Wednesday, further deterioration in the service sector could not be ruled out. This could weaken the pound further. Eurozone’s retail sales for October are expected to have risen, after falling the previous month. However, with the market aligned behind further easing by the ECB, these data are likely to pass unnoticed.
• In the US, the US final Markit service-sector and the ISM non-manufacturing PMIs are coming out. The market pays more attention to the ISM index, which is expected to have declined. This could add to the unexpected decline in the ISM manufacturing index on Tuesday and raise some concerns over the US economic recovery. The US factory orders for October are expected to have risen after falling in September. Initial jobless claims for the week ended November 27 are coming out as well.
• Besides ECB President Mario Draghi and Fed Chair Janet Yellen, we have four more speakers on Thursday’s agenda. Fed Vice Chair Stanley Fischer, Cleveland Fed President Loretta Mester, ECB Executive Board member Yves Mersch and Norges Governor Oystein Olsen speak during the day.
The Market
EUR/USD hits 1.0550 ahead of the ECB meeting
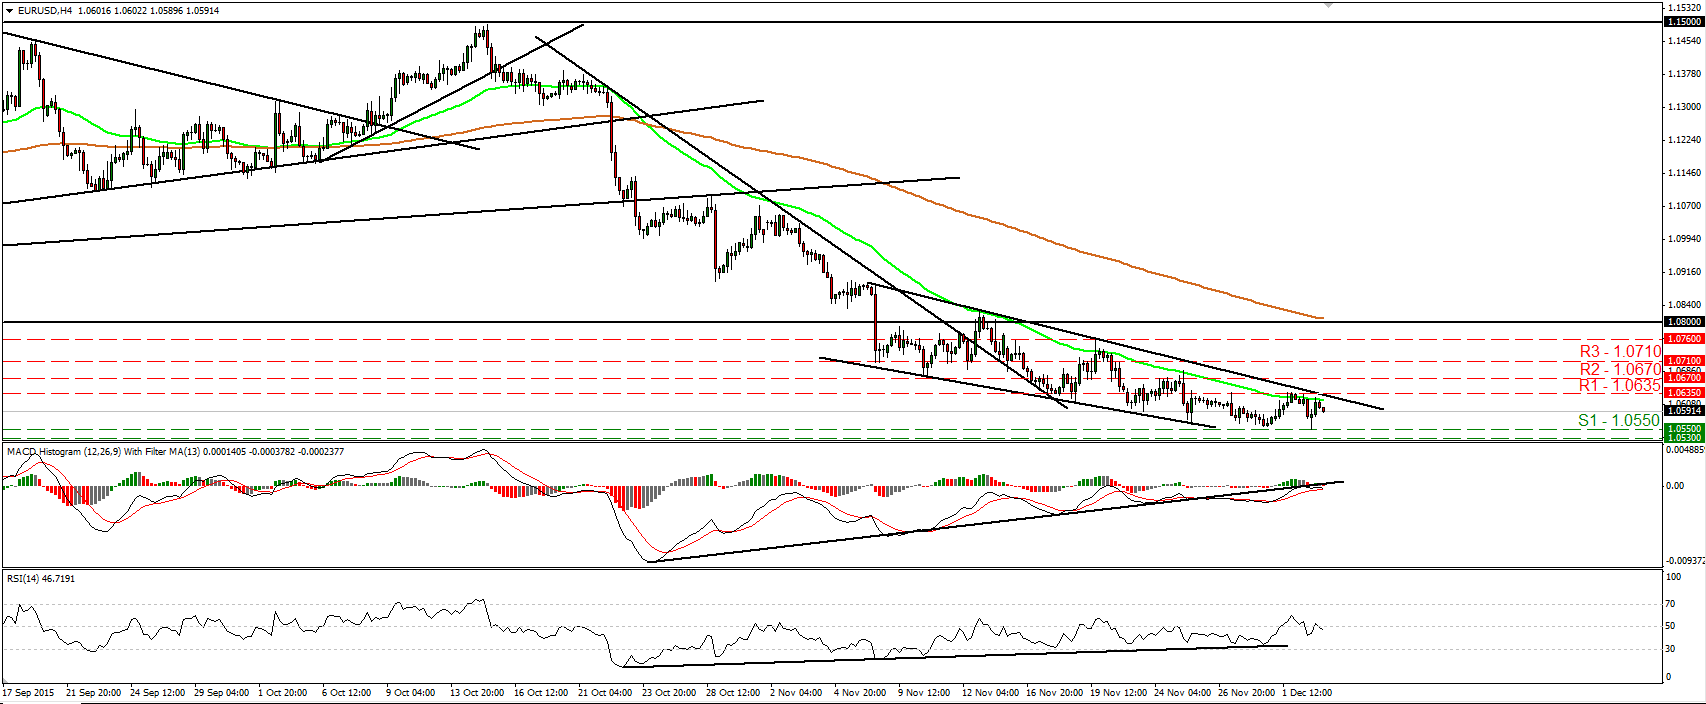
• EUR/USD traded lower yesterday following comments from Fed Chair Yellen, who appeared to keep the Fed on track to hike rates in two weeks. However, the pair hit support at 1.0550 (S1) and then it rebounded strongly. The advance was stopped once again slightly below the downside resistance line taken from the peak of the 6th of November, near the 1.0635 (R1) barrier. The short-term trend remains negative in my view and therefore, I would expect sellers to take in charge again and pull the trigger for another test at the 1.0550 (S1) zone. A dip below 1.0550 (S1) is likely to initially aim for the 1.0530 (S2) area, defined by the lows of the 13th and 14th of April. Today, the ECB meets to decide on its interest rates and the market expects Bank officials to deliver more stimulus. This could be the trigger for the next bearish leg. In the bigger picture, as long as the pair is trading below 1.0800, the lower bound of the range it had been trading since the last days of April, I would consider the longer-term outlook to stay negative. I would treat any possible near-term advances that stay limited below 1.0800 as a corrective phase.
• Support: 1.0550 (S1), 1.0530 (S2), 1.0500 (S3)
• Resistance: 1.0635 (R1), 1.0670 (R2), 1.0710 (R3)
GBP/USD closes the day below 1.5000
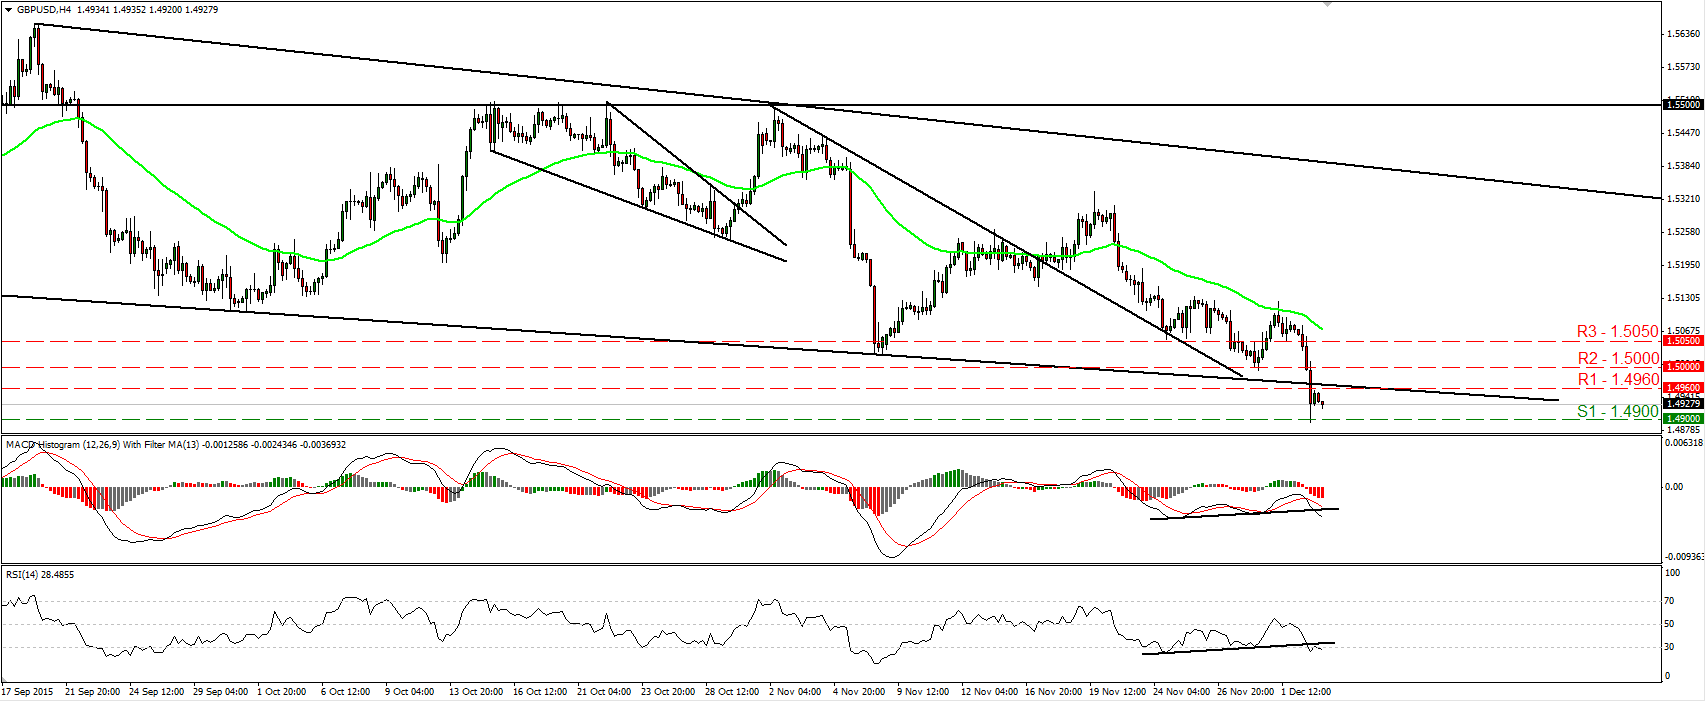
• GBP/USD plunged yesterday, falling below the psychological barrier of 1.5000 (R2) and subsequently below the downside support line taken from the low of the 4th of September. The decline was stopped near 1.4900 (S1) and then the pair rebounded to find resistance marginally below 1.4960 (R1). The short-term bias remains negative in my view and thus, I would expect a clear dip below 1.4900 (S1) to open the way for the 1.4850 (S2) obstacle, marked by the low of the 21st of April. Our short-term oscillators detect strong downside speed and corroborate my view. The RSI fell back below its 70 line and is pointing down, while the MACD stands below both its zero and trigger lines, pointing south as well. On the daily chart, the price structure remains lower peaks and lower troughs. Therefore, I still consider the longer-term trend to be negative.
• Support: 1.4900 (S1), 1.4850 (S2), 1.4800 (S3)
• Resistance: 1.4960 (R1), 1.5000 (R2), 1.5050 (R3)
USD/JPY looks poised to continue higher
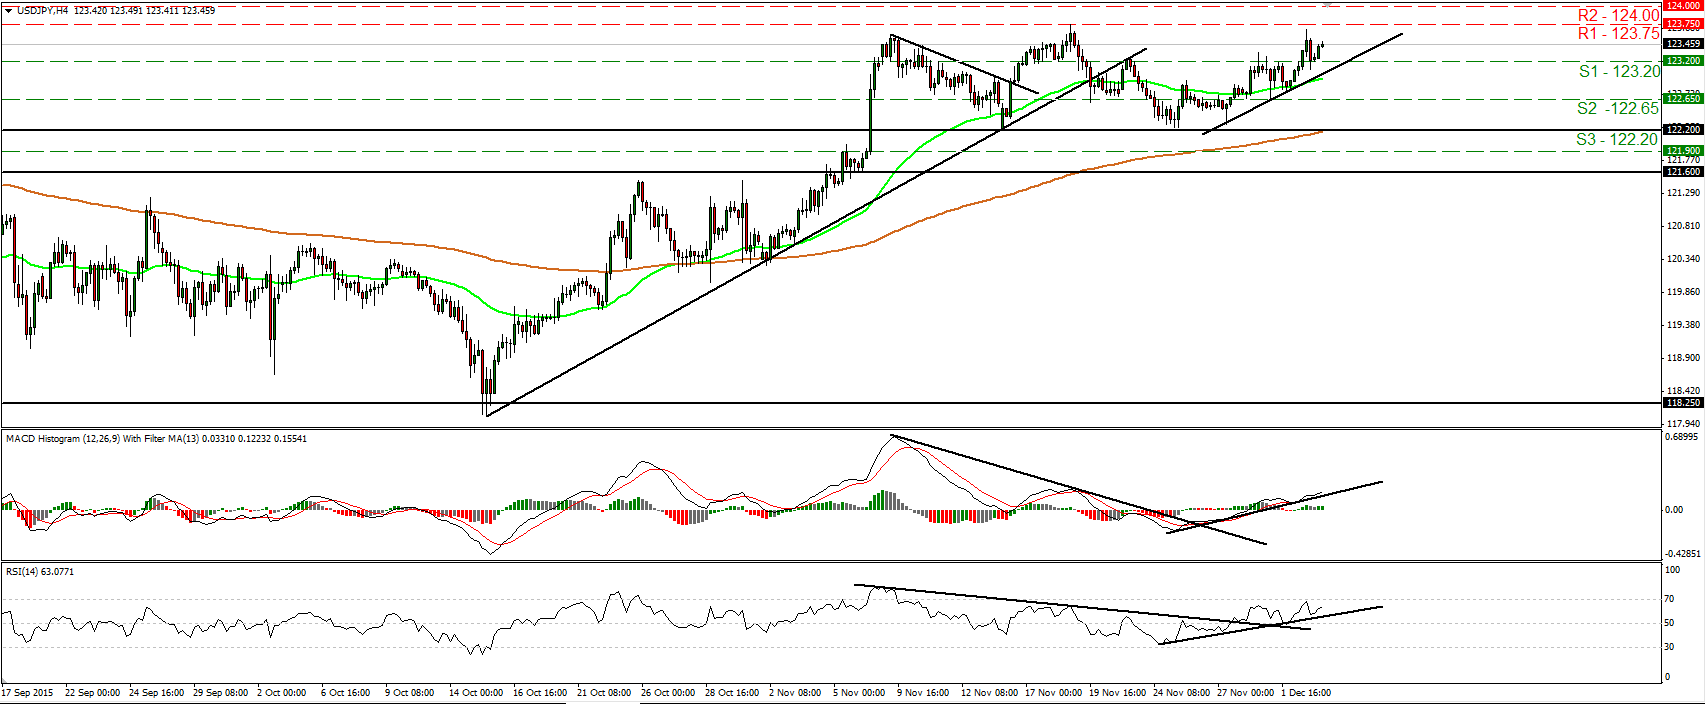
• USD/JPY traded somewhat higher during the Asian morning Thursday, after it found support near the 123.20 (S1) zone. The rate now looks to be headed towards the resistance hurdle of 123.75 (R1), where an upside break is likely to initially aim for the next obstacle at 124.00 (R2). Taking a look at our short-term oscillators, I see that the RSI rebounded from near its upside support line, while the MACD stands above both its zero and trigger lines, pointing north. These indicators reveal positive momentum and support that USD/JPY is likely to continue higher, at least in the short run. As for the broader trend, the break above 121.60 on the 5th of November signaled the upside exit of the sideways range the pair had been trading since the last days of August and turned the longer-term picture back positive. This enhances my view that USD/JPY is likely to continue higher in the foreseeable future.
• Support: 123.20 (S1), 122.65 (S2), 122.20 (S3)
• Resistance: 123.75 (R1), 124.00 (R2), 124.60 (R3)
Gold tumbles and hits support below 1050
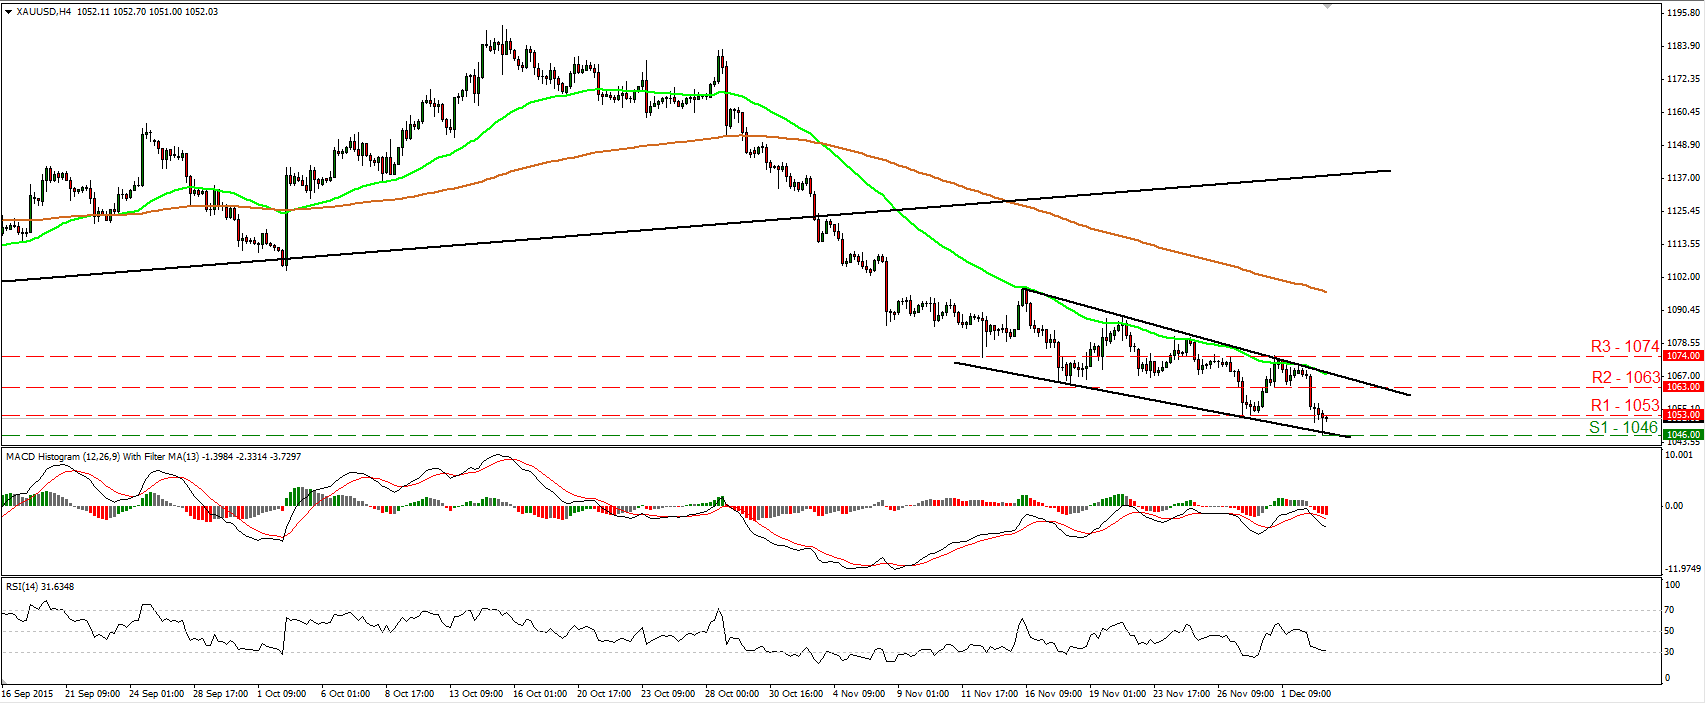
• Gold tumbled on Wednesday, falling below the support (now turned into resistance) of 1053 (R1) to hit support at 1046 (S1). The short-term outlook remains negative in my view and therefore, I would expect a clear move below 1046 (S1) to open the way for the 1035 (S2) zone, defined by the low of the 30th of October 2009. Our short-term oscillators detect downside speed and support the negative outlook. The RSI slid below its 50 line and reached its 30 line, while the MACD stands below both its zero and signal lines. However, given our proximity to a downside support line, I see the likelihood for a corrective bounce before the bears decide to shoot again, perhaps for a test at 1063 (R2). On the daily chart, I see that the plunge below the upside support line taken from the low of the 20th of July has shifted the medium-term outlook to the downside. As a result, I believe that the metal is poised to continue its down road in the foreseeable future.
• Support: 1046 (S1), 1035 (S2), 1025 (S3)
• Resistance: 1053 (R1), 1063 (R2), 1074 (R3)
DAX futures correct lower
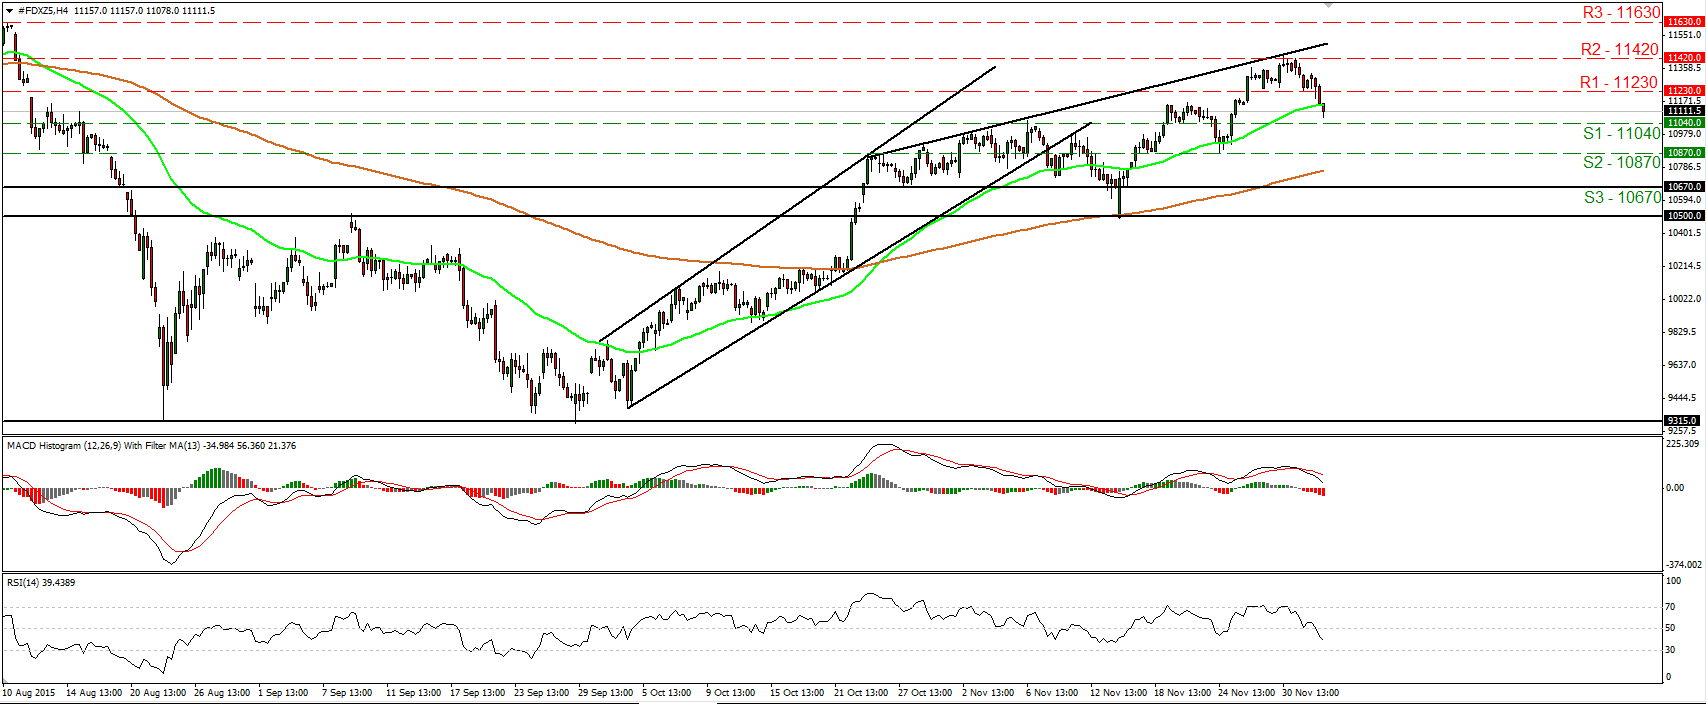
• DAX futures slid yesterday, falling below the support (now turned into resistance barrier) of 11230 (R1). The index is now headed towards the support line of 11040 (S1), where a clear dip is likely to extend the current setback towards the next support at 10870 (S2). Our short-term oscillators support that the current negative move may continue for a while. The RSI edged down and fell below its 50 line, while the MACD has fallen below its trigger line and is now headed towards its zero line. On the daily chart, the break above the psychological zone of 10500 on the 22nd of October signalled the completion of a double bottom formation. What is more, the rebound on the 16th of November from that psychological area adds to my view that the medium-term path remains positive. As a result, I would treat the current setback or any short-term extensions of it as a corrective phase for now.
• Support: 11040 (S1), 10870 (S2), 10670 (S3)
• Resistance: 11230 (R1), 11420 (R2), 11630 (R3)

