Forex News and Events
The week starts with higher risk aversion as dovish Fed comments raise fears on the health of the global economy. The USD opened weaker against the majority of G10 and EM currencies, except RUB and CAD. The slide in oil prices continue as WTI Crude losses reach 2.0% at the time of writing. The recent price cuts from the major oil producers raise speculations on a potential upcoming price war. In the Euro-zone, the focus is on September final inflation data. As the expectations remain subdued, tensions at the heart of ECB’s Governing Council escalate.
Euro-zone inflation on the calendar
The inflation data will likely occupy headlines in Euro-zone this week in the absence of major macro-events. French, Spanish and Italian figures are due on Tuesday; German data will come in on Wednesday. The Euro-zone’s aggregate inflation data is scheduled on Thursday, the expectations are soft.
During the IMF meetings in Washington, the ECB President Draghi repeated that he is looking to expand the ECB balance sheet by 1 trillion euros, to fight the deflation risks in the Euro-zone. Bundesbank’s Weidmann answer was rather cold, saying that “a certain target value for the balance sheet” has been communicated, “how formal this target is, that’s a different question”. The ECB is seemingly boiling given the German opposition to massive easing measures. As investors seek more details on whether a QE is underway, the German officials conflicting comments should attract only short-lived relief in EUR. Despite conflicting views in the heart of ECB’s Governing Council, the dovish stance remains irrefutably strong.
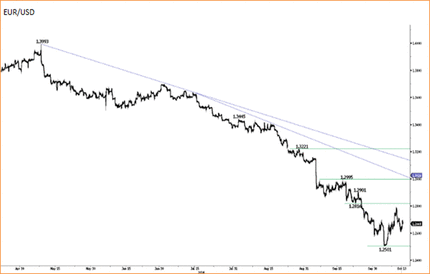
EUR/USD trades ranged given the lack of fresh direction at the week open. Offers are placed at 1.2700/43 (optionality / 21-dma) levels, more resistance is presumed pre-1.2853 (Fib 23.6% on May-Oct sell-off) should the weakness in USD continue.
EUR/JPY broke the key support at 135.73 and hit a fresh 2014 low (135.55). Trend and momentum indicators are comfortably negative, suggesting further losses ahead. Option barriers for today expiry are eyed at 136.75+.
Sell-off in oil raise the question of a price war ahead
The sell-off in oil continues as Iraqi SOMO (country’s State Oil Marketing Co.) said it will sell its Basrah Light crude to Asia at largest discount since 2009, following the price cuts on Saudi and Iranian oil. The slide in oil prices accelerated amid the increase in oil supply by OPEC last month (the most in 3 years). The US increased production to highest levels since 1986 on week to October 3rd (source: Energy Information Administration), while Russia also boosted supply last month, near January post-Soviet record high levels. The fight between oil producers to increase market share trigger speculations on a potential price war. The WTI crude tests $84 (Nov 2012 lows) at the time of writing; the Brent falls to $88.40 (lowest since Dec 2010).The speculative net WTI long positions fell to lowest since mid-2013 according to Oct 7th CFTC data. The Kuwait Oil minister said that the slide in crude may end at $76/77 levels based on production costs in US and Russia.

Today's Key Issues (time in GMT)
2014-10-13T10:00:00 USD No economic news
The Risk Today
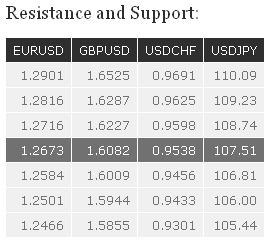
EURUSD EUR/USD is consolidating after its steep decline. An hourly resistance lies at 1.2716 (10/10/2014 high). Another resistance stands at 1.2816. Hourly supports can be found at 1.2584 (07/10/2014 low) and 1.2501. In the longer term, EUR/USD is in a succession of lower highs and lower lows since May 2014. The break of the strong support area between 1.2755 (09/07/2013 low) and 1.2662 (13/11/2012 low) opens the way for a decline towards the strong support at 1.2043 (24/07/2012 low). Intermediate supports are given by 1.2500 (psychological support) and 1.2466 (28/08/2012 low).
GBPUSD GBP/USD's bounce has thus far been unimpressive. Hourly resistances stand at 1.6227 (09/10/2014 high) and 1.6287. Hourly supports can now be found at 1.6009 (10/10/2014 low) and 1.5944. In the longer term, the collapse in prices after having reached 4-year highs has created a strong resistance at 1.7192, which is unlikely to be broken in the coming months. Despite the recent short-term bearish momentum, we favour a temporary rebound near the support at 1.5855 (12/11/2013 low). A resistance lies at 1.6525.
USDJPY USD/JPY is moving lower towards its key support at 106.81 (see also the rising trendline). Hourly resistances can be found at 108.18 (intraday high) and 108.74. Another key support lies at 105.44 (02/01/2014 high). A long-term bullish bias is favoured as long as the key support 100.76 (04/02/2014 low) holds. Despite a probable medium-term consolidation phase after the successful test of the major resistance at 110.66 (15/08/2008 high, see also the 50% retracement from the 1998's top), a gradual move higher is eventually favoured. Another resistance can be found at 114.66 (27/12/2007 high).
USDCHF USD/CHF is bouncing near the support implied by its rising trendline. Hourly resistances stand at 0.9625 and 0.9691. Hourly supports can be found at 0.9469 (09/10/2014 low) and 0.9433 (18/09/2014 high). From a longer term perspective, the technical structure favours a full retracement of the large corrective phase that started in July 2012. As a result, the recent weakness is seen as a countertrend move. A key support can be found at 0.9301 (16/09/2014 low). A resistance now lies at 0.9691 (06/10/2014 high).

