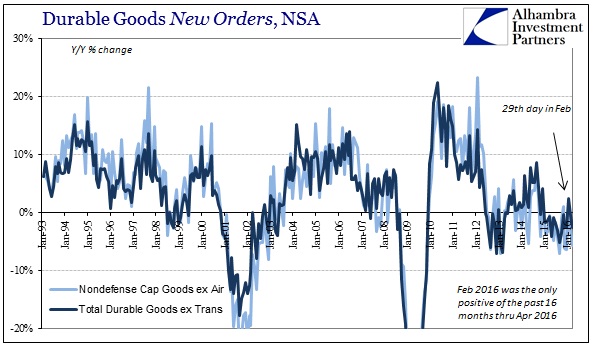
There wasn’t anything new or surprising in the advance durable goods report. Shipments (ex transportation) were flat and orders were up 1% year-over-year (NSA). Capital goods (non-defense, ex aircraft) shipments fell 3.4%, the tenth straight month of contraction, while new orders were down again (2.6%) for the sixteenth time out of the past nineteen months. The slump only continues.
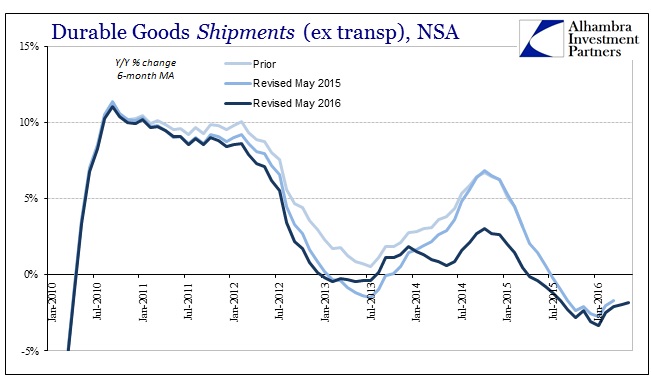
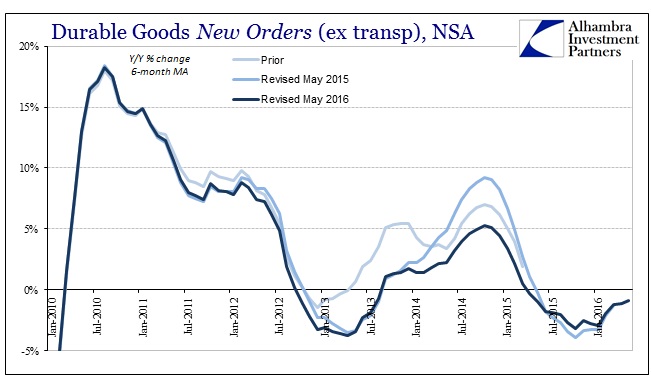
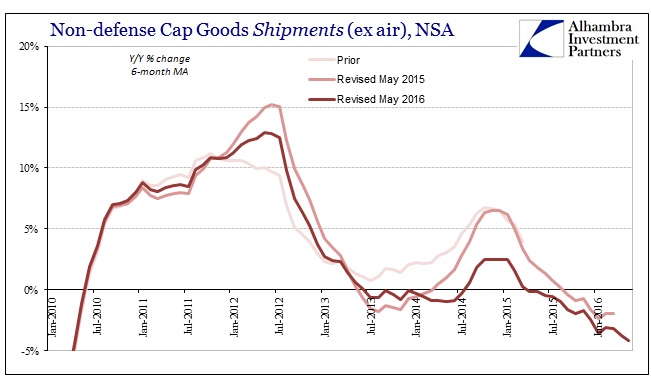
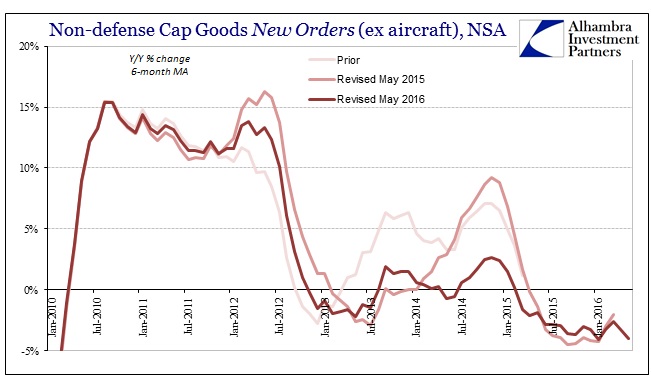
With last month’s benchmark revisions, however, we have a much better view of the overall slowdown. It increasingly appears as if there were not separate slumps divided by a late 2013/early 2014 rebound but rather a single, unbroken mess. The removal of the upward resumption in especially 2014 leaves the trajectory mostly flat, with minor deviations around that baseline. In late 2012, that was slightly negative, followed by only slightly positive until the “rising dollar” and now slightly negative once more. This pattern is consistent in each of these segments, durable goods and capital goods, shipments and new orders. That means the current “cycle” can be no cycle at all – it is something altogether different.
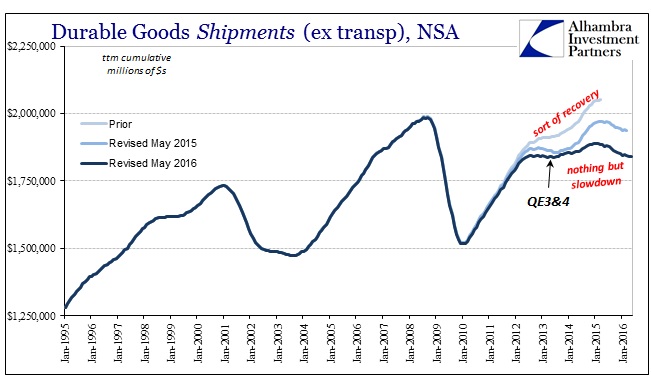
Part of the problem in appreciating the weight of observation in this regard is its sheer length in terms of time. Regardless of where you mark its exact beginning, the slowdown defies all sense of proportion; or even economic sense itself. The Great Recession was largely recognizable as all prior recessions in its familiar “V” shape. The dot-com recession is the only cycle that also significantly deviates from the norm; but almost in reverse of the current predicament.
The cycle in 2001 was recession first followed by an unusually bad or shallow recovery, before giving way to the expected sustained upswing. Thus, it was more “U” shaped than the consistent pattern through history. That meant from peak to ultimate trough it was much longer, and in many ways more problematic. Time is a valuable component in economics as finance, so the longer the economy underperforms to its baseline the more negative distortions and feedbacks develop.
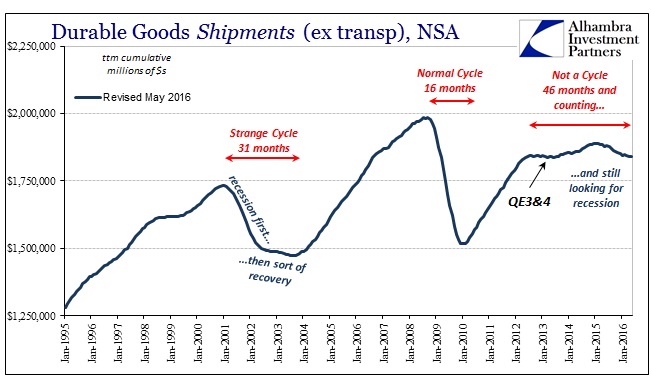
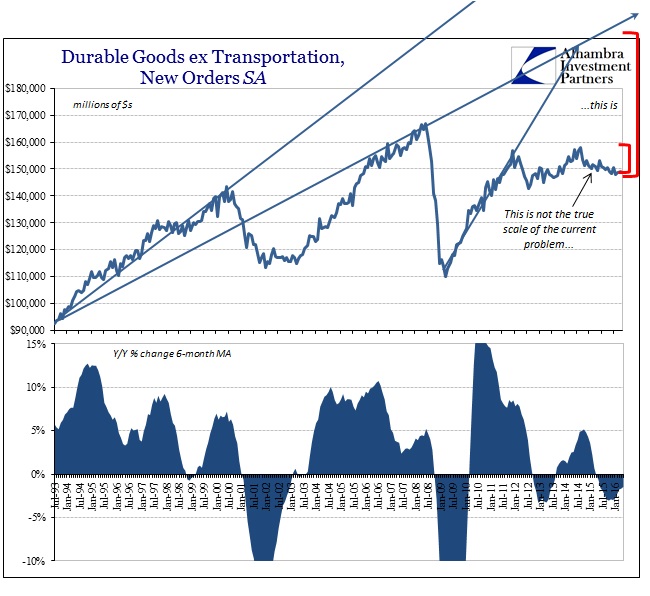
Using a trailing-twelve month cumulative total, the dot-com peak to trough was an elongated 31 months. The Great Recession, by comparison, was about half that length (though much more in depth). The 2012 slowdown is in a category all its own. In this view, it has been off-trend for an astonishing 46 months and counting, with recession (or at least deeper contraction) still left more the possibility than not. Though it may be somewhat similar to the 2001 cycle in its length, it is nothing like it in its appearance and activity.
Though the actual length of this sustained slump will vary depending on which particular data series or calculation of it that you use to measure, in each and every version they all point back to one specific event in time – the 2011 re-crisis. It is a demarcation that we find over and over, and not just in US economic history. Given that it was a global monetary event, it is very likely that we are witnessing a global economic problem tracing to (functional) money contraction.
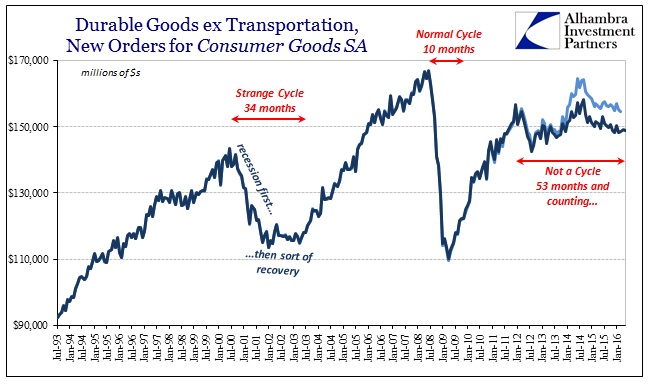
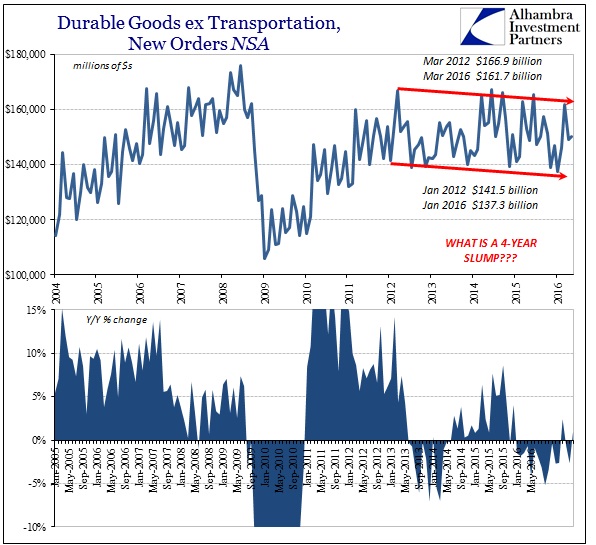
The weak recovery after the dot-com recession, at least in terms of US production of goods such as durable goods, might be readily explained by the move of productive capacity offshore (financed by the outbound portion of the eurodollar expansion). In other words, it was the trade of eurodollar-based debt through mortgages and consumer credit for imported goods. This time, however, the former “beneficiaries” of offshoring are sharing the burden of lack of growth – again tracing back to the same moment(s) in eurodollar history. 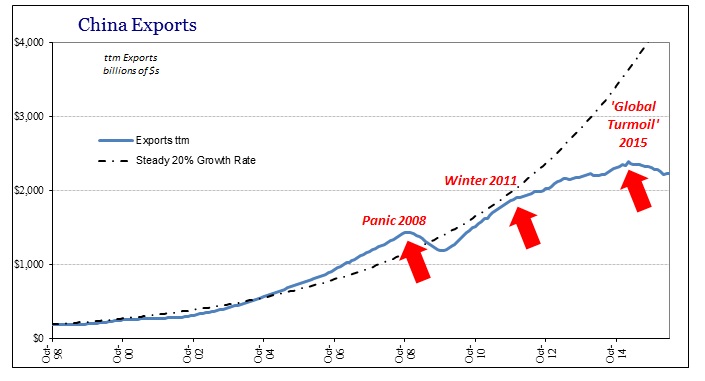
As I wrote earlier, it was all a money illusion on both sides:
The BLS tells us unequivocally that the labor market fell off around the dot-com bust and never returned. For a brief period in the middle 2000’s, that seemed not to have mattered because the debt flow was so immense in this direction that the developed world could temporarily finance its own impoverishment. The eurodollar system was feeding the capex “revolution” in emerging markets while simultaneously financing the very customers (at the margins, which were by then unusually thick) that were supposed to support it forever more.
US production in the middle 2000’s suffered the consequences but the US economy was temporarily, financially shielded from them. On this side of the GR, however, nobody is protected. Monetary contraction works on both ends; and in many ways it is and has been worse where it should have been best – in the EM’s that were taking in all the manufacturing work.
That means that the odd cyclical pattern of the dot-com recession and recovery is somewhat related and due to the same sorts of distortions; in full view, however, there isn’t much that we can use from it to predict what comes next in 2016. There is simply no historical precedence for this, save one: the Great Depression. Obviously, even suggesting something like that immediately creates a defensive posture. I am not suggesting we are heading toward a similar calamity, rather the tendencies and trends will likely be more familiar in general outline even if we can have no idea yet of the ultimate magnitude.
This is the difference, then, between recession and depression (small “d”). A recession is a temporary deviation from trend that leaves no significant, permanent mark upon the economy. A depression is not just an elongated recession, it is a determined change or alteration in the underlying trend (that just happens to take a long time to get from A to B). I find only increasing evidence for this theory, especially as it relates to the monetary component, which is and has been for decades the principal (artificial) baseline all along.
The Great Recession, then, is mislabeled. It wasn’t a recession at all; it was the opening act for this transformation – one that was set permanently in place by the events of 2011. Admittedly, durable goods is a narrow view of the economy, but in the context of more global factors it adds yet more evidence to the already considerable catalog.
