
Bitcoin (BitfinexUSD) price maintained a comfortable range over 64 days before the U.S CPI data release. The price momentum rallied BTC over 24% in the last seven days, while the knock-on effect of the BTC rally has appreciated the Top 20 cryptocurrencies on average by 13.50% in the previous seven days.
Additionally, the price action has met Nov 2022 resistance ahead of the U.S Federal Reserve meeting in 3 weeks. An over-extended stochastic and diminishing momentum may allow the price to breathe before pushing higher towards Sep 2022 resistance based on the narrative that the Fed may pause. Alternatively, if the Fed continues to hike and market sentiment changes towards a recession, we may see a price action correct between 12 and 17 percent in the BTC/USD pair.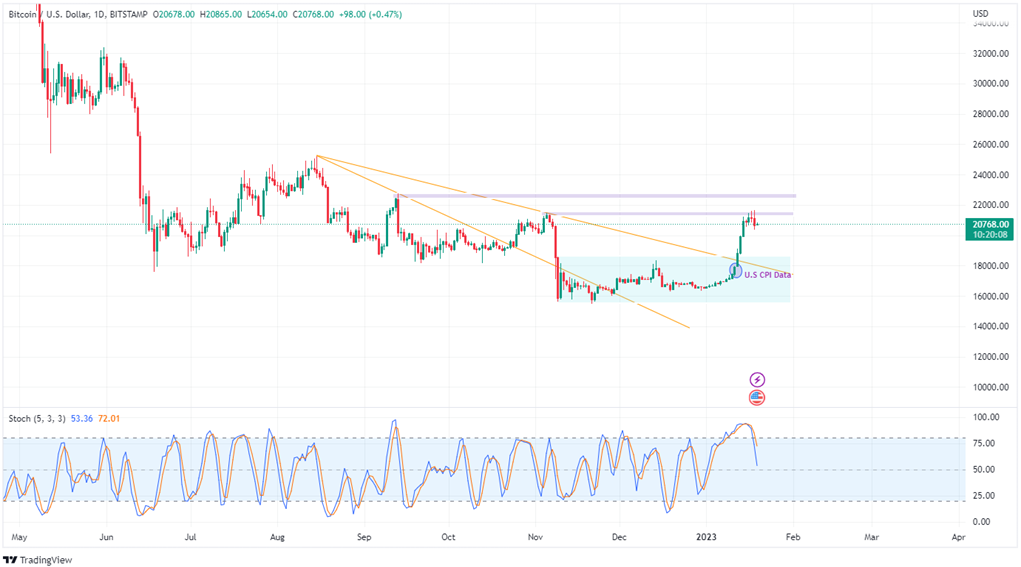
What Does Exchange Flows Tell Us?
Total exchange inflow is a promising indicator for measuring selling pressure or volatility. Considering the last two weeks, more significant inflows to all exchanges were captured for BTC as volatility escalated, pushing the price out of a 64-day range. Moving over to Net flows on all exchanges post, the market rally has seen outflows dominate, leading us to believe that smart money chooses to rebalance their holdings after closing derivative positions.
Supporting that evidence, Inflow and Outflow Mean to MA7 across exchanges signifies either cycle tops or bottoms through the peaks of the purple line (Mean, MA7). This leads us to anticipate that from an exchange perspective, we would see a correction in price before the momentum picks up again, supporting an overbought stochastic and diminishing momentum.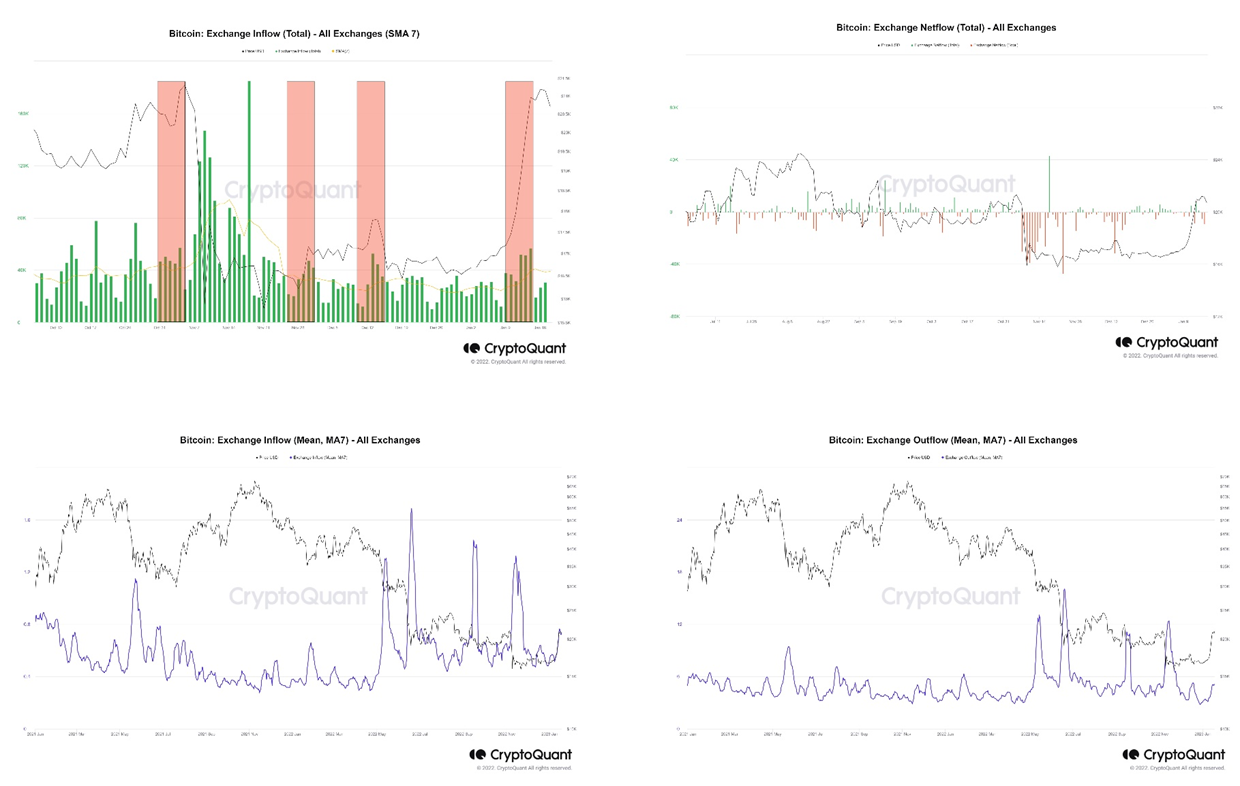
The open interest of BTC does support the narrative of volatility increasing steadily despite the recent drop, which falls in line with significant outflows. Overall, the market does remain net long in the derivative market, indicated by Funding Rates on all exchanges. 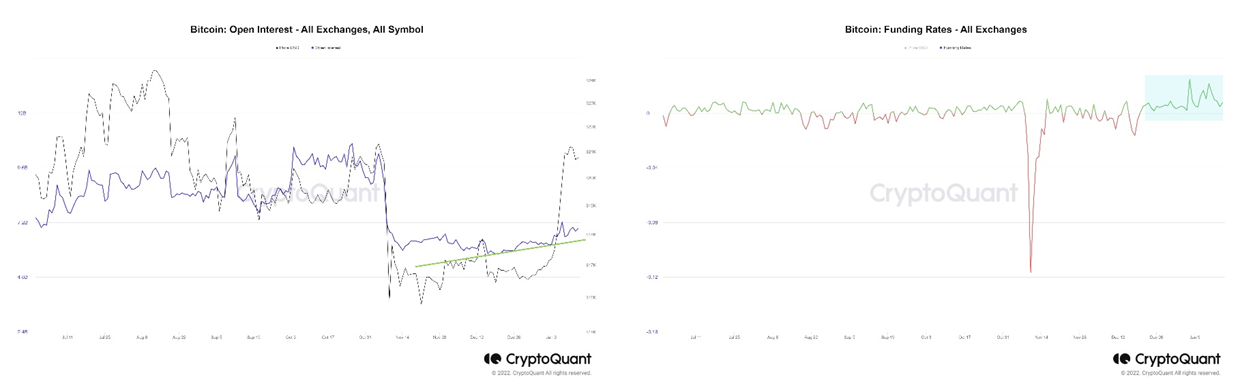
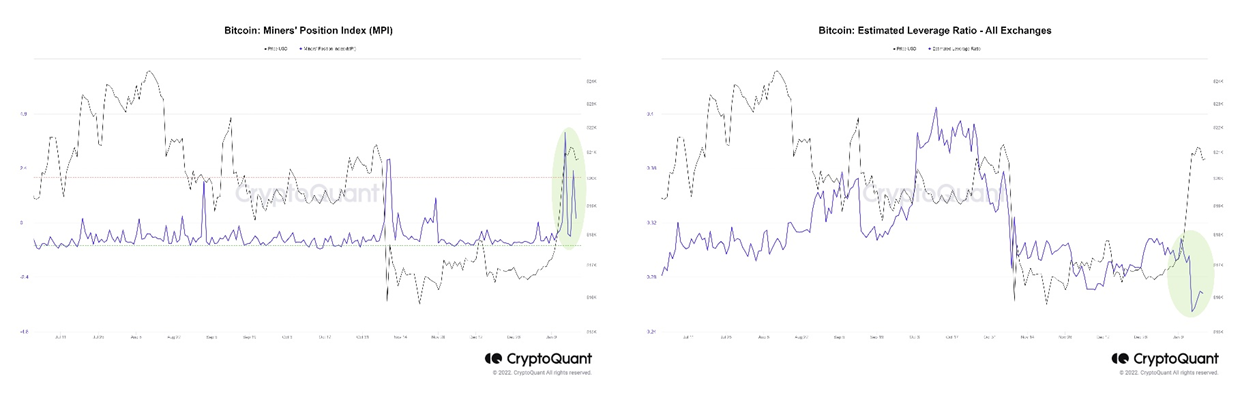
Mining activity and a leverage ratio support a near-term correction of BTC price action. The Miner Position Index measures is dollar-denominated total miner outflow to its moving average over one year. The index considers high values (Purple Line) an indication that miners send coins to exchanges which suggests bearish price action approaching. That’s what can be seen over the last two weeks.
The leverage ratio of the retail market volatility has eased significantly as the leverage ratio across exchanges decreased sharply. This means that investors have reduced their exposure to the derivative market. In comparison, it does remain contradictory to open interest and the funding rate charts, however, adding to the supporting idea that smart money took profits at the current levels and deleveraged their open positions.
Overall, market sentiment has changed to near-term bearish from an on-chain perspective. If we continue to see the macro environment deteriorate, namely the U.S. stock market, in conjunction with a hawkish tone by the Fed in the coming weeks, BTC price action will correct sharply to the downside.
Disclosure: The research conducted is for informational purposes only and does not constitute financial advice.