The US dollar got a boost from the Fed's minutes yesterday which has come out hawkish than expected. The EUR/USD, gold, and yen weakened against the greenback, but the sterling remained resilient. However, GBP/USD is limited in its upside at 1.46 and could see a move lower in the coming weeks. For EUR/USD, USD/JPY and gold a modest pullback is likely ahead of further trend continuation.
EUR/USD Daily Analysis

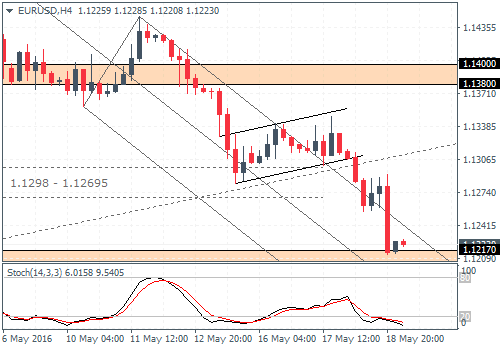
EUR/USD (1.122):EUR/USD slipped below the 1.130 support with a bearish candlestick following the previous two days of flat price action. A test of 1.120 cannot be ruled out, but the declines are likely to be limited in the near term. The 4-hour chart's bearish flat pattern has seen prices fall to the 127.20% Fib extension level but is supported by the lower support zone near 1.12170 - 1.120. Any upside bounces could see a move back to 1.1282,and a break above this bear flag's low could see a retest of the 1.138 - 1.140 resistance level.
USD/JPY Daily Analysis

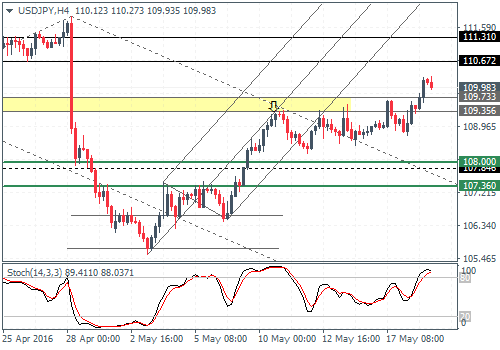
USD/JPY (109.98):USD/JPY continues to push higher, but price action is capped by the 50-day EMA. The retest of 107.955 still remains an open question. On the 4-hour chart, further bullish momentum is unlikely at the current levels with the recently broken resistance level at 109.73 - 1.9.35 likely to be tested. But a break below this resistance could see USD/JPY retest the break out from the median line near 108 levels.
GBP/USD Daily Analysis

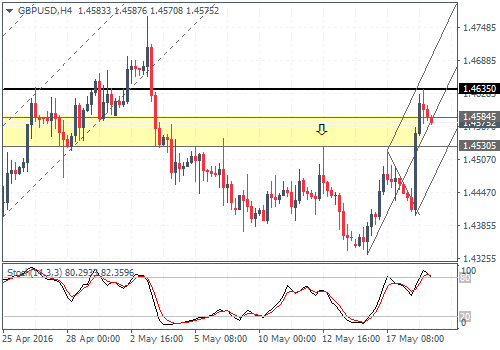
GBP/USD (1.457):GBP/USD posted an impressive rally yesterday testing 1.46 highs. But this level coincides with the main horizontal resistance zone and a retest of the median line on the daily chart. The lower high formed in GBP/USD could signal a move lower with 1.42 being the most ideal support level that could be tested. The main resistance is seen at 1.4635,and as long as price doesn't close above this level, GBP/USD could be pushing lower in the near term, with the first support at 1.43 ahead of a move to 1.42.
Gold Daily Analysis

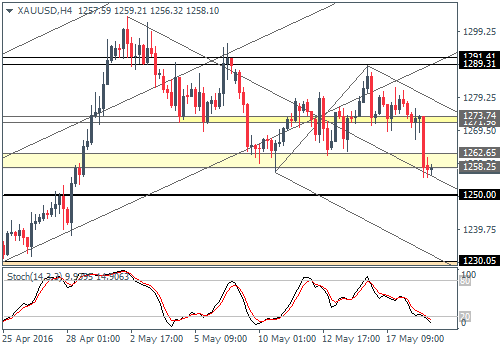
XAU/USD (1258):Gold prices declined yesterday, and the breakout from the lower median line on the daily chart signals a move lower. However, price action is at the 1260 - 1258 support level, and we expect a modest bounce off this support. 1289 - 1290 remains a level of interest in the near term. On the 4-hour chart, we can see the price action currently attempting to hold on to the support zone at 1262 - 1258. Near term, gold could stay range bound below 1273 - 1272 resistance.
