Following strong daily sessions of gains, the US dollar index closed in a doji pattern yesterday which could signal a near-term pause to the bullish momentum. With a new trading month and lots of economic data on the tap today, the markets could be looking to see some pullback from the recent trends.
EUR/USD Daily Analysis

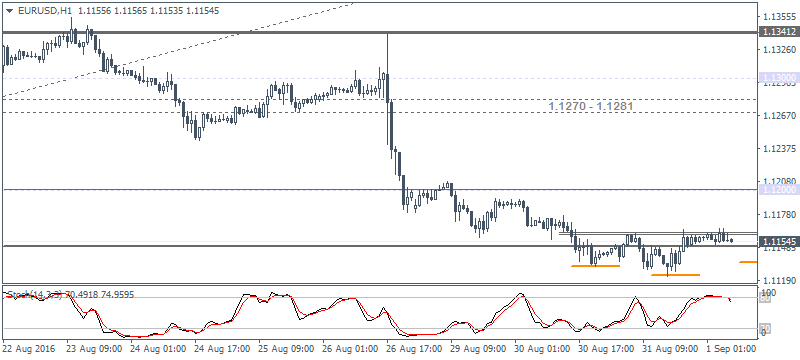
EUR/USD (1.1154): EUR/USD tested a new 2-week low yesterday at 1.1122,but price action managed to close on a bullish note just a few pips off the 1.1100 support level. The bearish momentum is likely to keep prices subdued with EUR/USD likely to test the lower support. On the 4-hour chart, price action remains bearish, but the hourly chart shows a possible inverse head and shoulders pattern that is likely to be formed. The neckline resistance is seen at 1.1160 - 1.1150. As long as the previous low is not breached, any higher low on the intraday time frame could signal a possible move to the upside. Resistance at 1.1200 remains key, and only a break above this level will signal further upside to 1.1270 - 1.1281.
USD/JPY Daily Analysis

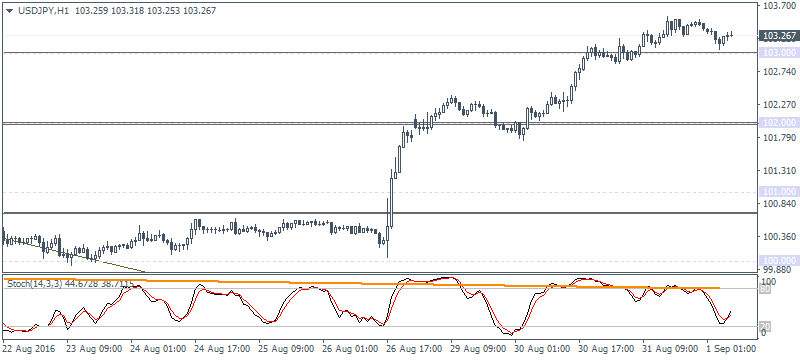
USD/JPY (103.26): USD/JPY continued its bullish momentum yesterday with prices closing at a 5-week high. The main resistance is seen at 104.00 which could be tested while support near 102.00 is formed. On the 1-hour time frame, price action shows a strong bearish divergence and a break below 103.00 intraday support could trigger further downside towards 101.00 - 100.80 level.
GBP/USD Daily Analysis

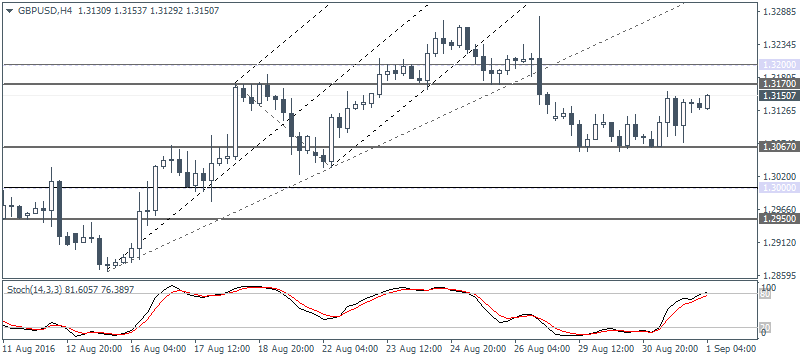
GBP/USD (1.3150): GBP/USD was bullish yesterday with price action likely to test the upside to 1.3200. Today's manufacturing PMI could very well be the catalyst if the headline print manages to beat expectations. On the 4-hour chart, the resistance at 1.3200 - 1.3170 remains likely to be tested, but the Stochastics points to a hidden divergence that could keep prices capped if the resistance fails to give way. The lower support at 1.3000 remains key in this aspect if the resistance level holds.
Gold Daily Analysis

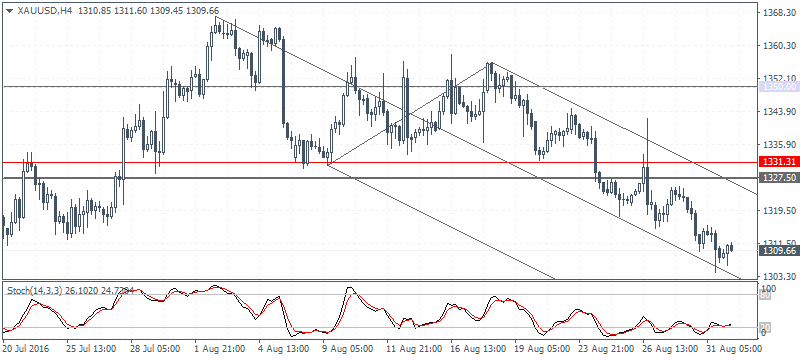
XAU/USD (1309.66):Gold prices inched closer to the 1300 psychological support but price formed a low near 1304.31. Still, the downside momentum could keep gold pressured lower as 1300 remains a key support level that could be tested. On the 4-hour chart, mind the bullish divergence on the Stochastics, although price action needs to form a higher low for any validation. Resistance at 1331 - 1327.50 remains in sight for a near-term pullback to this short term downtrend.
