An upside revision to the US GDP for the fourth quarter sent the greenback stronger across the board. However, market sentiment is currently pointing to a modest risk aversion with the yen gaining in early Asian trading, which could, in turn, see the euro attempt to post a recovery rally. End of month flows could also keep the US dollar volatile on the last trading day of the month.
EUR/USD Daily Analysis

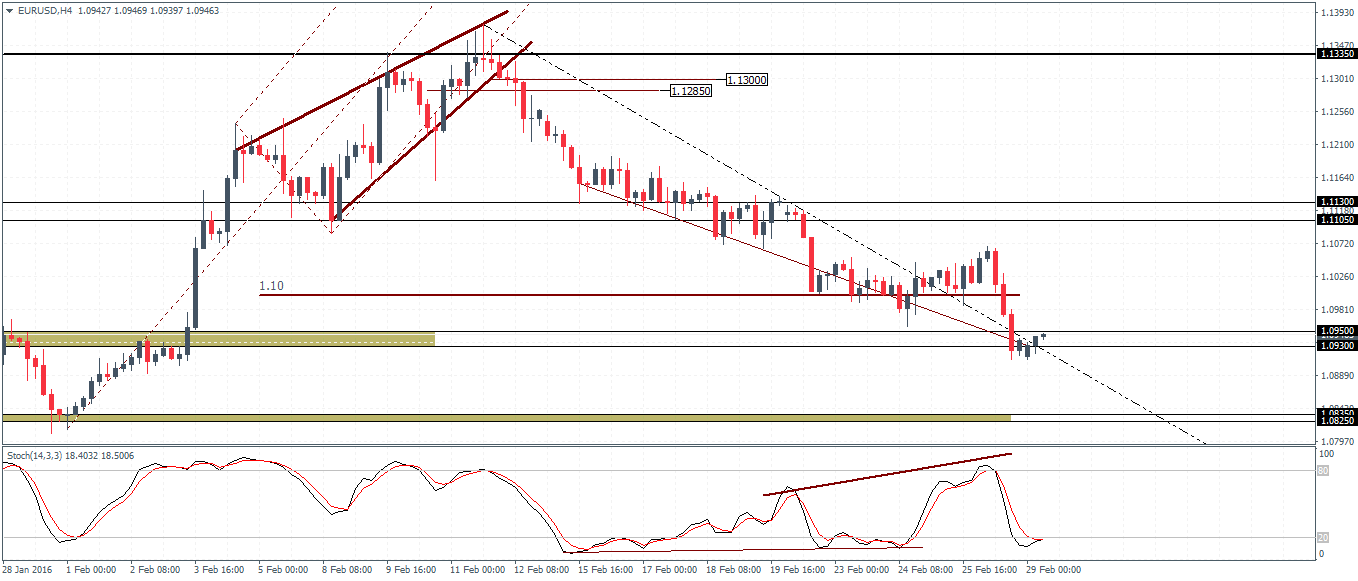
EUR/USD (1.09): EUR/USD closed Friday with strong losses, as prices briefly fell below the 1.10 handle. The decline comes after nearly three days of sideways price action indicating a further decline to the downside on a successful close below 1.089. With prices trading in the support level of 1.095 - 1.093, EUR/USD could be attempting a go at reclaiming the 1.10 support/resistance level. However, the upside momentum is capped with resistance at 1.113 - 1.1105 likely to hold the rally. Below 1.093, EUR/USD could be looking at testing the previous lower support at 1.0835 - 1.0825.
USD/JPY Daily Analysis

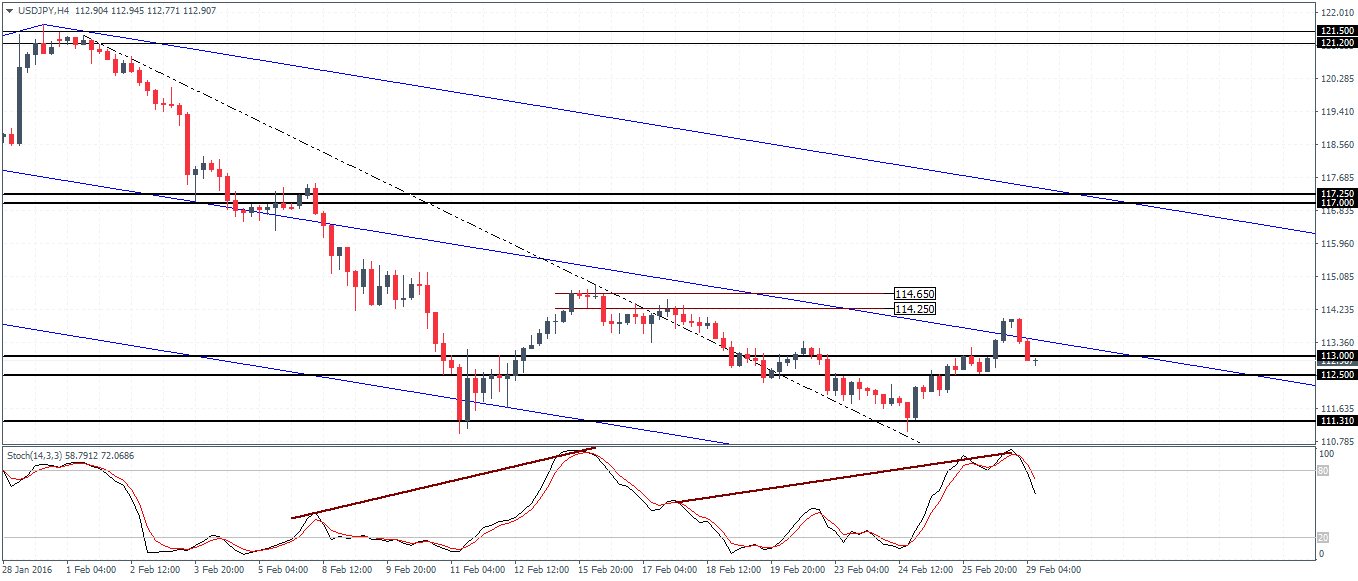
USD/JPY (112.9): USD/JPY rallied strongly after forming a doji pattern last week near 112 support. The support saw USD/JPY rally towards 113 region, but current price action is bearish with greenback easing against the yen. To the downside, a continued momentum could see USD/JPY test 111.31 levels in the near term following the hidden bearish divergence formed on the charts. A test to 111.31 with a potentially higher low in the Stochastics could see a move to the upside on a close above 113 - 112.5 resistance. The upside target to 117 remains in place as long as USD/JPY does not see a daily close below 111 – 111.31 support.
GBP/USD Daily Analysis

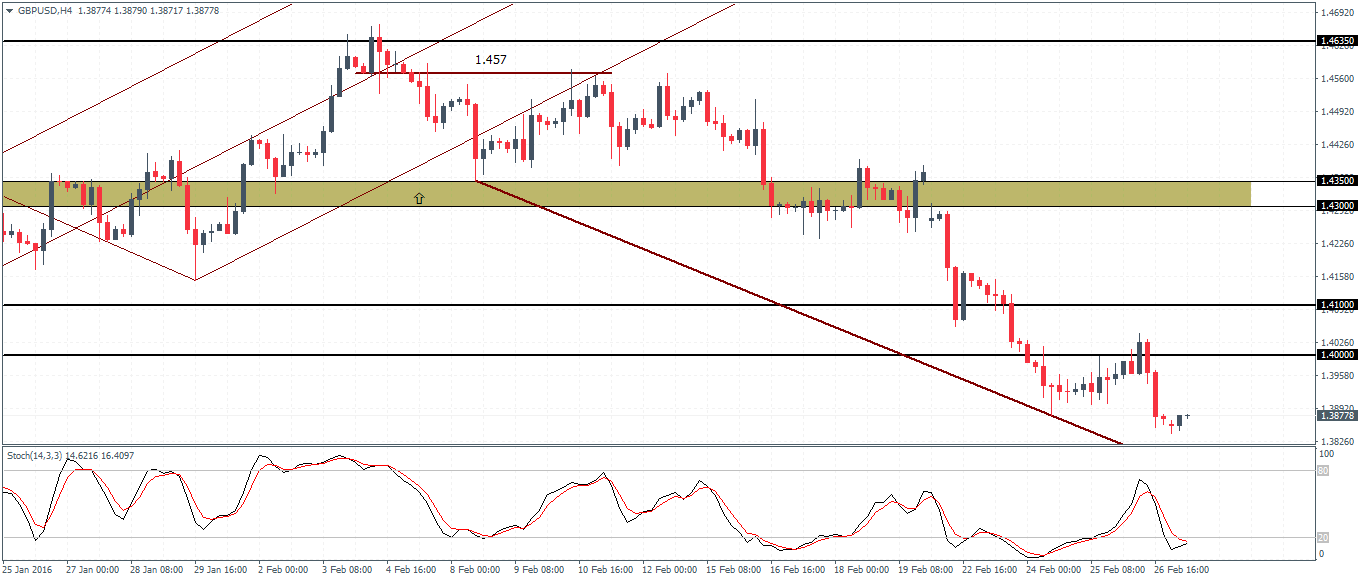
GBP/USD (1.387): GBP/USD closed bearish on Friday following Thursday's attempt at a bullish close. On the daily chart, prices are trading close to the lower median line, which, if it supports prices, could lead to a possible short-term bounce. Currently, GBP/USD has formed a doji on the 4-hour chart followed by a bullish close higher. A continuation to this could see prices eventually rise back to the 1.40 handle where resistance is previously established. The Stochastics on the 4-hour chart also points to a bullish divergence taking shape. Below the current lows at 1.387, GBP/USD could be at risk for a dip to 1.385.
Gold Daily Analysis

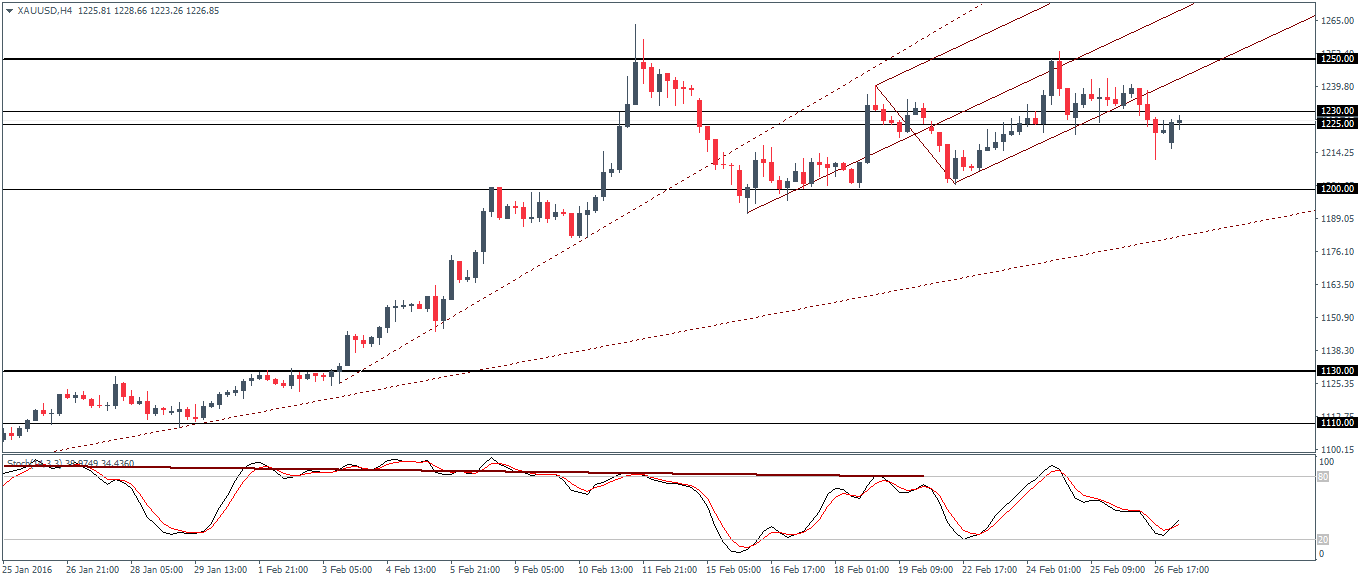
XAU/USD (1226): Gold prices continue to trade sideways with the 1200 support holding prices strongly. However, the strong consolidation is likely to give way to a strong momentum-led rally or a decline. On the 4-hour chart, minor support/resistance is seen at 1230 - 1225 region. The median line connecting the recent price action shows gold breaking outside the lower median line. With a near-term top formed at 1250 and a modest lower high being formed, gold could remain range bound between 1230/1225 and 1200 region. The bias remains to the downside with the potential to test 1130 on a break below the 1200 support.
