
FOMC to Market: Get Ready, Cause Here We Come
The dollar gained across the board (again!) after the minutes of the Federal Open Market Committee (FOMC)’s latest meeting showed that the hawks within the FOMC are shifting the grounds of the debate. There was no discussion on whether a rate hike might be warranted; rather, the group only debated whether to begin raising rates earlier than they currently anticipate in light of the rise in inflation and the faster-than-expected improvement in the labor market. The key passage read: o “…many participants noted that if convergence toward the Committee’s objectives occurred more quickly than expected, it might become appropriate to begin removing monetary policy accommodation sooner than they currently anticipated. Indeed, some participants viewed the actual and expected progress toward the Committee’s goals as sufficient to call for a relatively prompt move toward reducing policy accommodation to avoid overshooting the Committee’s unemployment and inflation objectives…”
At the end they decided they needed to see more evidence before changing policy, but the message to the market was clear: get ready, ‘cause here we come!
The comments show a more aggressive stance among the FOMC members than Fed Chair Yellen has indicated. She has been careful to balance statements about how rate hikes might come earlier than expected if the economy continues to improve at a faster-than-expected pace with comments about how hikes might be delayed if the economy underperforms. At the FOMC meeting however there was only discussion about the former possibility, not the latter. Investors will be waiting to see whether Yellen continues with a balanced view in her discussion of the labor market tomorrow or whether she too has become more confident about the outlook.
The significant point for me is that while the FOMC is debating whether they might have to raise rates sooner than they had anticipated, the market still hasn’t caught up to the FOMC’s existing expectations. Fed funds rate expectations for July 2017 rose 6 bps yesterday, but the market is still far behind the Fed – the average weighted FOMC expectation for rates at end-2016 is 86 bps or three rate hikes higher than the market’s forecast. This means there is still plenty of room for market expectations to adjust and for the dollar to move still higher. One more positive indicator: the US stock market closed higher Wednesday despite the hawkish tone of the minutes, indicating that the FOMC is not likely to be deterred from hiking out of fear of the stock market’s reaction.

Today’s indicators: Today is PMI day. While the expansion continues at a steady pace in the US, the view from China turned a bit darker. The preliminary August HSBC/Markit manufacturing PMI for China fell to 50.3 from 51.7, far worse than market expectations of 51.5 and barely remaining in expansionary territory. Although recently AUD has not been as sensitive to Chinese data as it used to be, today there was a clear drop of 20 pips in AUD/USD when the figure came out. I would look for the currency to move lower still.

The PMIs will take center stage during the European day as well. Eurozone’s preliminary PMIs for August are released shortly after the figures for the two largest countries of the bloc, Germany and France, are announced. The single currency bloc’s PMIs are expected to decline slightly, reflecting the overall slowdown in growth and economic turbulence in the region. That could put EUR/USD under some further downward pressure. Later in the day, Eurozone’s preliminary consumer confidence index is released.
Elsewhere in Europe, Sweden’s official unemployment rate for July is forecast to decline to 7.4% from 9.2% (NSA), in contrast with the increase in the Public Employment Service (PES) unemployment rate earlier this month. The strong improvement in labor market will most likely offset the recent unchanged CPI reading and could strengthen SEK amid the positive data. From Norway, we have the Q2 GDP which is expected to rise at a +0.5% qoq pace from +0.3% qoq in Q1. On top of the recent robust data coming out from the country, strong growth could add further strength on the Norwegian krone.
In the UK, retail sales excluding gasoline for July are expected to rise 0.4% mom, a turnaround from -0.1% mom in the previous month. That could be positive for the pound, but given the recent negative sentiment towards the sterling it is unlikely to be sufficient to reverse investors’ mood, in my view.
Later in the day, we get the US preliminary Markit manufacturing PMI for August and existing home sales for July. Home sales are expected to be a bit lower, which could provide an upward surprise, given the strength of other recent housing data. The initial jobless claims for the week ended 16th of August are also coming out and the forecast is for the figure to decrease marginally, which would also be USD-positive. The country’s leading index for July and the Philadelphia Fed business activity index for August are also coming out.
The Fed’s annual symposium for central bankers at Jackson Hole begins today. The theme this year is “Re-evaluating Labor Market Dynamics”. The event gathers Fed officials, the nation’s leading economists and international central bankers to discuss the outlook for the economy and monetary policy.
We have one speaker scheduled on Thursday’s agenda, Riksbank first Deputy Governor Kerstin af Jochnick speaks.
The Market
EUR/USD violates 1.3300
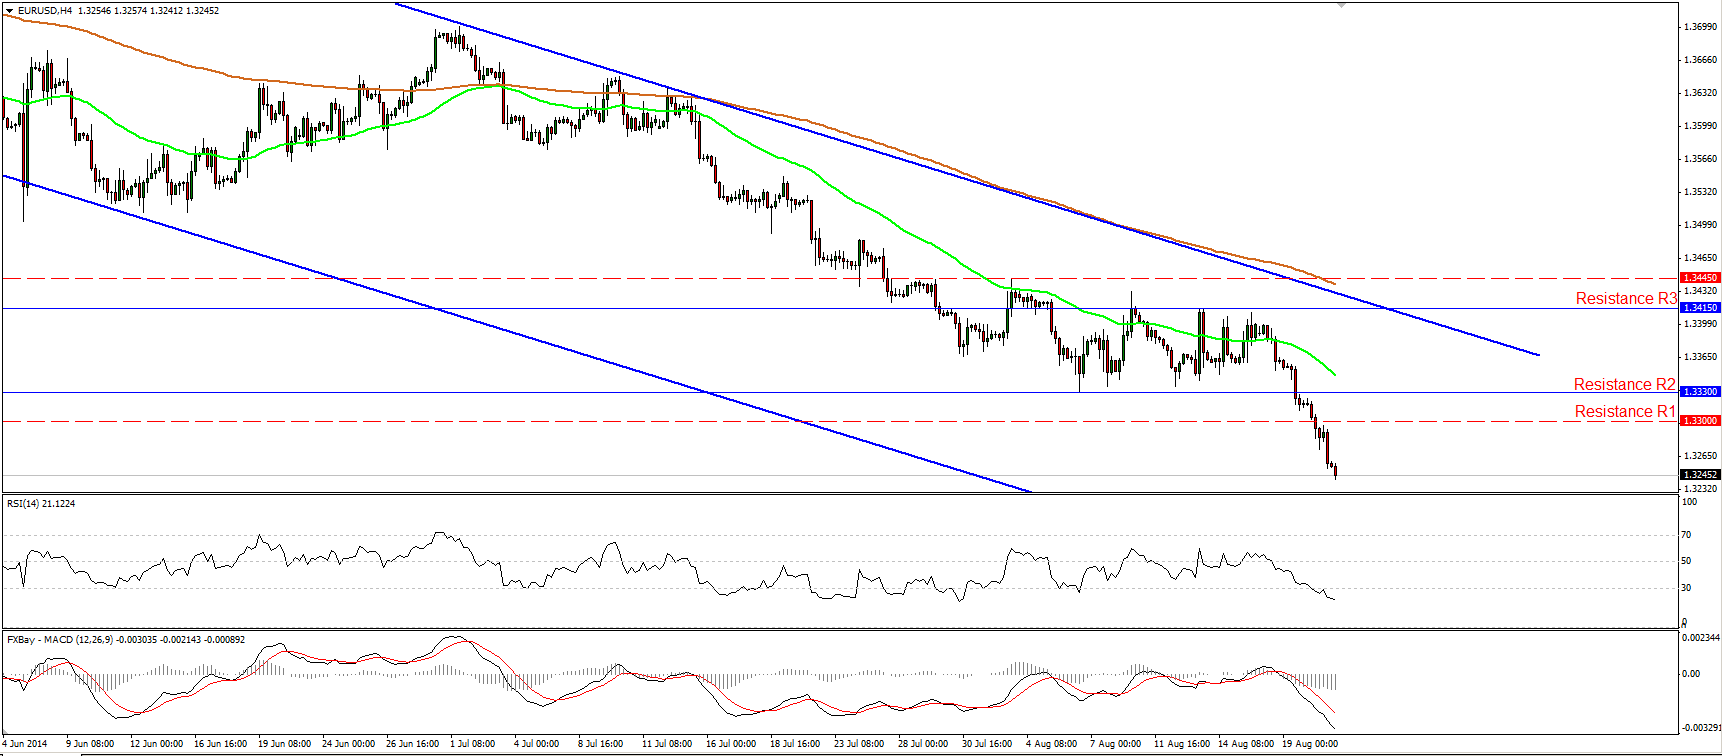
EUR/USD fell below the obstacle of 1.3300 (support turned into resistance) and got another push down after the minutes from the FOMC meeting showed that some Committee members are pushing for an early hike in rates. Taking into account that today we have Eurozone’s preliminary PMIs for August, which are expected to have declined, I will stick to the view that we may see the rate testing the 1.3200 (S1) line, initially. Further selling pressure could see scope for extensions towards our next support level, at 1.3100 (S2). I would ignore the oversold reading of the RSI, since the oscillator is pointing down and does not seem willing to exit its extreme territory any time soon. As long as the pair is trading within the blue downside channel, connecting the highs and the lows on the daily chart, the overall outlook remains negative, in my view.
• Support: 1.3200 (S1), 1.3100 (S2), 1.3000 (S3).
• Resistance: 1.3300 (R1), 1.3330 (R2), 1.3415 (R3).
GBP/JPY breaks the near term downtrend line

GBP/JPY surged yesterday, violating the blue short-term uptrend line and confirming the positive divergence between both our momentum studies and the price action. However, the rally was halted slightly below the key resistance barrier of 172.50 (R1), near the 200-period moving average. As a result I will take the sidelines at the moment, to see if the bulls are strong enough to overcome that key line, or if the bears are ready to take action near that zone once again. A clear move above 172.50 (R1) is likely to extend the advance towards 173.50 (R2), while a move below 171.60 is needed to reinforce the prior downtrend and perhaps target the support of 170.75 (S2).
• Support: 171.60 (S1), 170.75 (S2), 170.45 (S3).
• Resistance: 172.50 (R1), 173.50 (R2), 174.20 (R3).
NZD/USD dips below 0.8400

NZD/USD broke below the key barrier of 0.8400 (support turned into resistance), but the decline was stopped marginally above our support of 0.8340 (S1). The rate is trading below both the moving averages and below the prior long-term uptrend line (light blue line), drawn from back the low of the 30th of August 2013. Thus, I would consider the bias to be to the downside and a decisive violation of the 0.8340 (S1) support is likely to pave the way towards 0.8250 (S2). Nevertheless, zooming on the 1-hour chart, the 14-hour RSI seems ready to rebound from its 30 line, while the hourly MACD shows signs of bottoming and could move above its signal line soon. Having that in mind, I cannot rule out a minor bounce, some short-covering, before sellers prevail again.
• Support: 0.8340 (S1), 0.8250 (S2), 0.8150 (S3).
• Resistance: 0.8400 (R1), 0.8500 (R2), 0.8555 (R3).
Gold falls below 1295

Gold tumbled after the FOMC meeting minutes were released, falling below the 1295 barrier (support turned into resistance). Now I would expect the metal to challenge the support line of 1280 (S1). If the bears are strong enough to overcome it, we could experience extensions towards the next obstacle at 1267 (S2). The MACD lies below both its trigger and zero lines, while the RSI fell below 30, but is pointing down. This confirms the accelerating negative momentum of the price action and magnifies the case for the continuation of the decline, at least towards the 1280 (S1) support. However, on the longer-term time frames, I still see a trendless picture and this is confirmed by the fact that both the 50- and 200-day moving averages are still pointing sideways, while both our weekly momentum studies lie on their neutral lines.
• Support: 1280 (S1), 1267 (S2), 1258(S3).
• Resistance: 1295 (R1), 1305 (R2), 1323(R3).
WTI rebounds somewhat

WTI rebounded somewhat from the 92.60 (S1) support but found resistance at 93.70 (R1). The price structure remains lower peaks and lower troughs below the blue downtrend line and below both the moving averages, and this keeps the overall outlook to the downside. A clear dip below 92.60 (S1) is needed to signal a forthcoming lower low and probably target our next support at 91.60 (S2). Nevertheless, considering that the negative divergence between the RSI and the price action is still in effect, I will stay flat for now, until both momentum studies and price action point in the same direction.
• Support: 92.60 (S1), 91.60 (S2), 90.00 (S3).
• Resistance: 93.70 (R1), 95.35 (R2), 96.70 (R3).

MARKETS SUMMARY
