Momentum can be an excellent tool for understanding the movements in the market and the ‘health’ of a trend. I like to see momentum for a market reflect the price action – hitting new highs and staying in its own version of an up trend. I often look for divergences in momentum, signs where price is heading one direction but momentum is going the opposite direction as warning signs of a potential change in trend for price.
Each Weekly Technical Market Outlook post I write shows the daily chart of the S&P 500 (SPX) and three momentum indicators, the Relative Strength Index (RSI), MACD, and the Money Flow Index. However understanding what’s happening on higher time frames can be just as important, if not more so, when analyzing the market. With that, lets check in on the weekly and monthly charts.
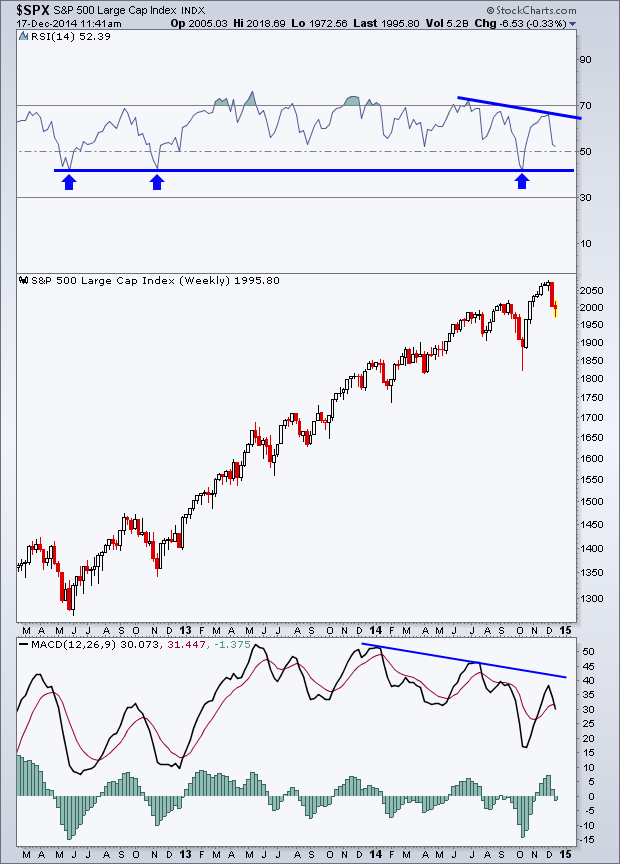
First up is the weekly chart of the S&P, along with the RSI and MACD indicators. Since the 2011 near-bear market the Relative Strength Index (RSI) has been in a bullish range. We’ve seen this measure of momentum continuously hit ‘overbought’ levels while holding above 40 on downturns. This tells us that momentum is strong and the trend in price should remain intact.
Recently the RSI and began making a series of lower highs as price as continued to advance. The first lower high was followed by a near 10% drop in the S&P back in October. Since then, the market has rallied and hit new highs and the divergence has steepened. While this bearish divergence is considering, the indicator remains in a bullish range as holds above its prior lows.
When looking at the MACD indicator, which is another well-known measure of momentum, it also has been experiencing a bearish divergence. The difference between the RSI and MACD divergences is the MACD downturn has been with us for all of 2014. So far the S&P has seen 3 distinct lower highs in the MACD, which is more than we saw going into the 2007 peak.
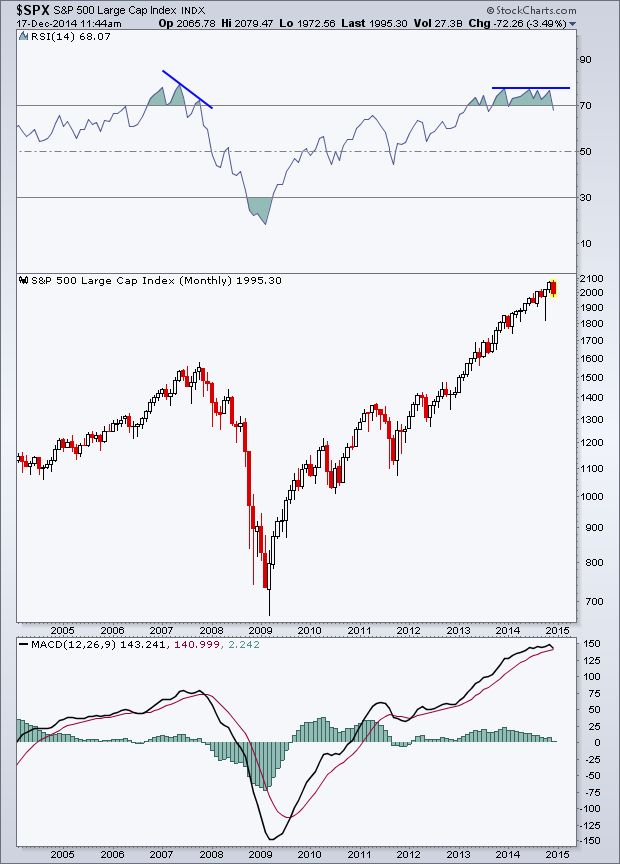
The monthly chart of momentum for the S&P 500 can cause confusion for some traders. Many will look and see that we’ve been ‘overbought (over 70 on the RSI) for almost the entire year and point to that as a reason to be bearish. But we know better! being ‘overbought’ just means that momentum is strong, it doesn’t require the price to go down substantially. Going into the 2007 peak, the monthly RSI began making a lower high. We aren’t seeing that type of bearish action in the latest set of data. While the peaks in the momentum indicator are not all exactly to the same level, in my opinion they are still showing strong signs of positive momentum. I’m currently watching to see if a break under 70 falls under the prior August 2013 low and if it’s then followed by a clear lower high on any rebound we see soon follow.
The MACD indicator has done a nice job highlighting the slow grind higher in momentum. With the recent weakness in December the fast line (black line) is close to crossing below the slow line (red line) which many traders view as a bearish signal. While I’m not overly concerned with the absolute level of the MACD, it’s interesting to note that we are currently seeing stronger momentum based on the currently monthly reading than at the 2000 and 2007 highs.

So what is momentum telling us? In my opinion, the weekly and month charts have continued to confirm the bull market and the up trend in U.S. stocks. While the divergences that are taking place in the RSI and MACD on the weekly chart are concerning and could lead to a protracted downturn, the fact that the Relative Strength Index remains in a bullish range is a positive sign in my eyes. We’ve yet to see a breakdown on the monthly chart, which would likely occur, but of course is not a requirement, ahead of a major market high.
Understanding what’s taking place on the higher time frames can give us clarity and a break away from the noise that takes place on the intraday and even the daily charts.

