
It might not be an easy task to find high-quality dividend stocks from a universe of over 2000 counters. This is where the powerful “I Dream of Dividends” screener comes in handy.
While going through the list of stocks from the screener one counter caught my attention is Coal India.
Coal India Limited
Coal India Ltd (NS:COAL) is the largest coal producer in the world, having a market capitalization of INR 2,81,503 crore. The stock has delivered a very healthy return of 98.4% in the last 1 year, but still trading at a single-digit TTM P//E ratio of 9.58.

Image Source: InvestingPro+
The financial health check score of 4 out of 5 makes it a compelling bet as it clearly states the robust fundamentals of the company. Profitability matters for any dividend-paying company, and Coal India clocked a net income of INR 28,165.19 crore in FY23 which is the highest ever.
ProTips also suggests that the company has been paying dividends for over 14 years now, which is commendable and it is a cash-rich company, holding more cash than debt on its balance sheet.
Currently, the stock is trading at a dividend yield of 5.57% which is the highest among all Nifty 50 stocks. Rarely, does one get to find a blue chip company that’s at such an impressive yield. Investors can also see the entire dividend payout history in InvestingPro+ in the form of beautiful yet easy-to-read histogram charts.
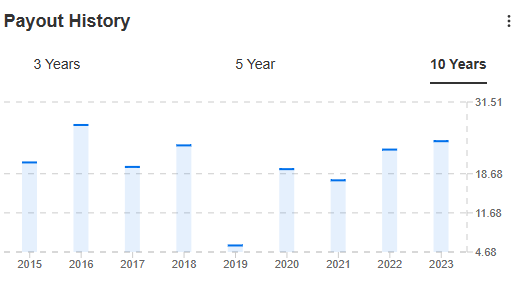
Image Source: InvestingPro+
These charts help to visualize the payout trend of the company which can be helpful in the decision-making process. For eg. in this case, you can see, that Coal India has more or less maintained an average payout of around INR 18.5 per share, over the last decade. These visuavilizations helped to spot stability in dividend payment which is crucial for any dividend stock.
The dividend yield chart is also a powerful tool. It takes both the share price and DPS (dividend per share) into consideration and plots the yield on the chart. This helps in gauging the trend in the yield and comparing it with the past ones which significantly improves the timing of entry.
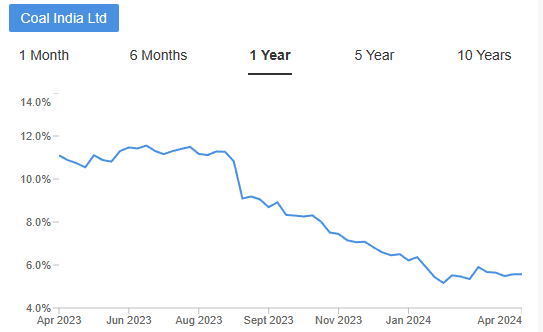
Image Source: InvestingPro+
For eg. here you can see that the yield line has more or less flattened out since February 2024, meaning the yields are not dropping anymore. This could be a reversal sign as it indicates, either the price is not rising anymore, or the DPS is not falling. Both of these are good indications for a dividend stock.
With its robust algorithms and user-friendly interface, this screener empowers investors to sift through vast stock universes swiftly, saving precious time while maximizing returns. Whether you're a seasoned investor or just starting out, this powerful tool streamlines the process, allowing you to focus on what truly matters—building a high-quality dividend portfolio.
Say goodbye to tedious manual searches and hello to a smarter, more efficient way to invest with InvestingPro+ by CLICKING HERE, now available at a discount of 69%, for INR 526/month.
X (formerly, Twitter) - Aayush Khanna