Markets were extremely overbought last weekend and began to roll over this week right on schedule. We are well off those overbought readings now and are setting up for another round of strength as stocks work to complete bases.
From what I see there is nothing that tells me we are in for anything more than a small consolidation period, not any sort of major correction. We are still in a fantastic market for swing trades of a few days or more.
While many stocks still need a bit of time to complete major bases which will take them much higher, and quickly, we have been picking up nice gains of $10 or $15 in short order and then booking those gains before consolidation occurs. These swing trades can really add up while we wait for the major buy and hold signal.
Gold had a decent week but is still not looking good. I had quite a few emails telling me I’m going to eat crow on my call for lower gold and that is fine. I never profess to be correct all the time, that is what stops are for. That said, I still think gold moves lower.
Let’s take a look at the charts.

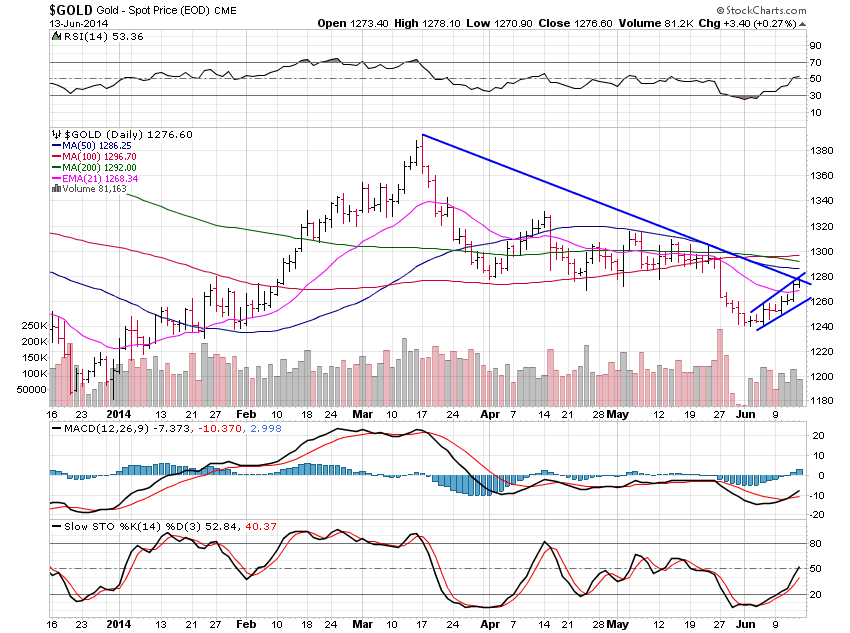
Gold gained 1.93% this past week.
I really see this move higher as being on the back of the fighting in Iraq and that is all. I imagine it is a buy the rumor, sell the news type of move. If the US does help out over there then chances are high that gold will sell down. Gold is still forming a bear flag or rising channel which most times will break to the downside. There is so much horizontal chart resistance and the 50, 100 and 200 day moving averages are all hanging around $1,300 making that area very tough to overcome.
I do not see any reason why gold can move above $1,300 at the moment but if it does then I will quickly chance my stance to a more positive one. All I do is tell what I see in the charts and it is very often correct. If I am proven wrong I have no problem admitting it and changing my view.
I am not biased at all one way or the other except for what the charts tell me. I did note to subscribers Wednesday evening that many mining stocks and related tracking ETFs had a strong day and that was something to keep an eye on since it could mean some strength for gold and that is what came about.

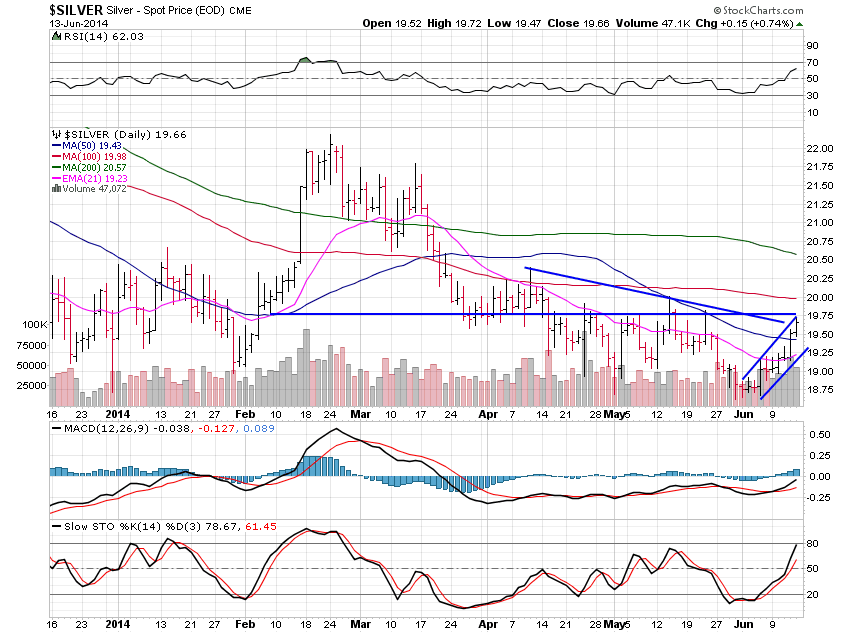
Silver gained 4.37% this past week and is rising for the simple reason that gold is. Just as stocks have been strong, metals have been weak and they need to catch their breath before resuming their trend, which is lower for gold and silver. $19.75 presents some strong resistance.
I like to see moves like two steps forward and one step back. The step back is like a breath for us and allows the force needed to push the trend forward. As long as we see two steps forward, one step back type of action, the trend should continue. Once we being moving strongly in the trend and spiking, then we are near the end.
Gold is still leading silver.

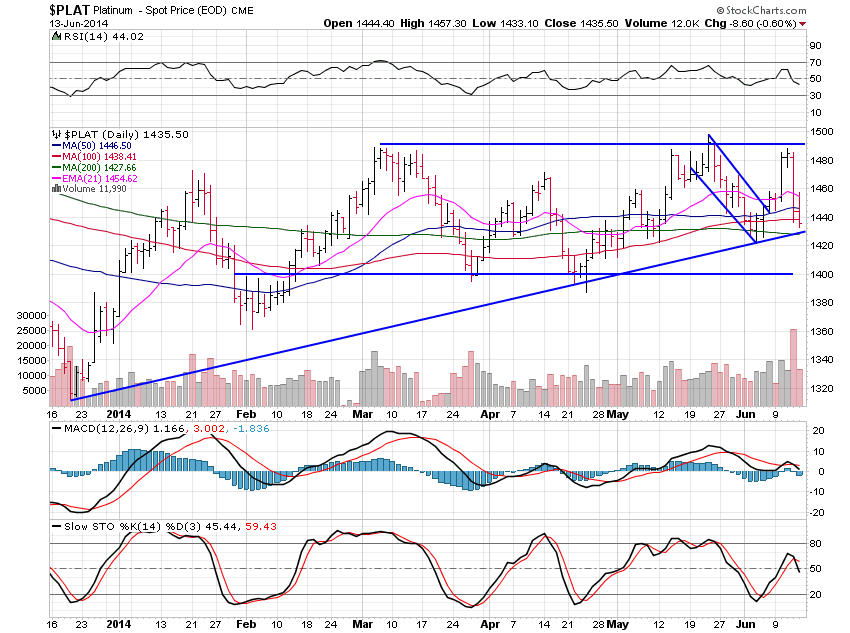
Platinum lost 1.25% this past week and backed off the $1,490 area I talked about last weekend in this letter. Last week I showed the descending channel as it was just starring to break. I said a move to $1,490 would be next and that would be it. $1,490 was almost hit perfectly before a sharp selloff.
I don’t like targets since some people wait for the exact price to be hit. Support and resistance areas are a much better way to look at it, I find.
Once we approach those levels we have to watch the action and if we begin to reverse from there with volume coming in, it is time to exit the trade. It’s not that often I nail exact tops and lows but catching most of the move is entirely possible and timing the market is absolutely possible no matter what anyone else tells you.
As Mark Twain would say, market and stock moves don’t repeat, but they sure do rhyme.

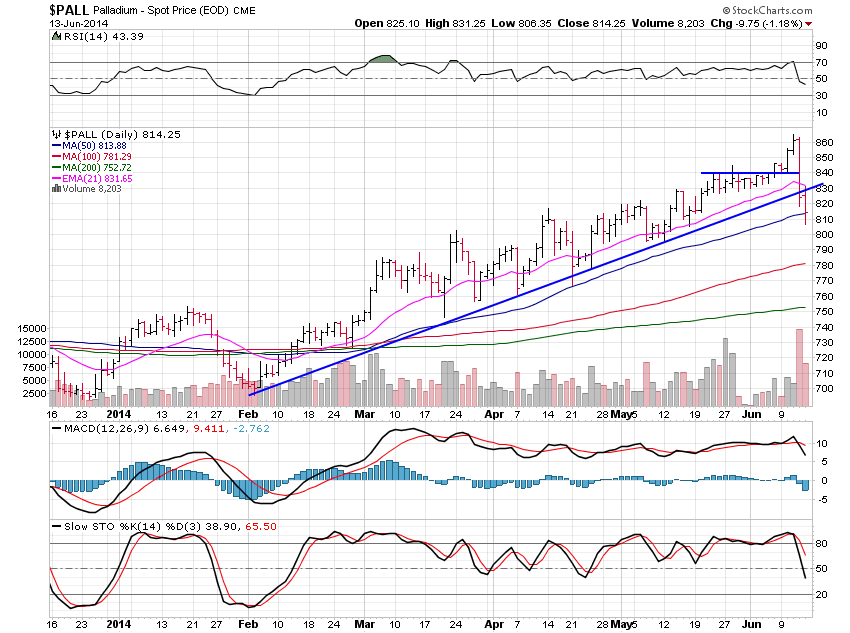
Palladium fell 3.77% and must hold this area or risk moving back to $790. Last week I said palladium was headed to all-time highs but I was wrong. The action told me palladium was breaking out and volume was confirming this at the time.
Palladium quickly reversed and moved back below the breakout level at $840. I didn’t trade this move but had I, I would have been in on the breakout above $840 and then out right away once that level was broken for cost or a small loss.
Just because the chart looked great and acted super doesn’t mean it will work all the time and once it is proven to be a false breakout, taking a small loss is key. I won’t be stubborn and stick to my trade if I am told I am wrong by the price action.
Palladium has to hold its 50 day moving average here and quickly move back above the uptrend line at $830 or the trend higher is broken.