Get 40% Off
👀 👁 🧿 All eyes on Biogen, up +4,56% after posting earnings. Our AI picked it in March 2024.
Which stocks will surge next?
Unlock AI-picked Stocks

USD/CHF Collapses, Avoid Trading GBP/USD Until It Clears 1.5385

Published 10/12/2015, 05:06 AM
Updated 07/09/2023, 06:31 AM

USD/JPY

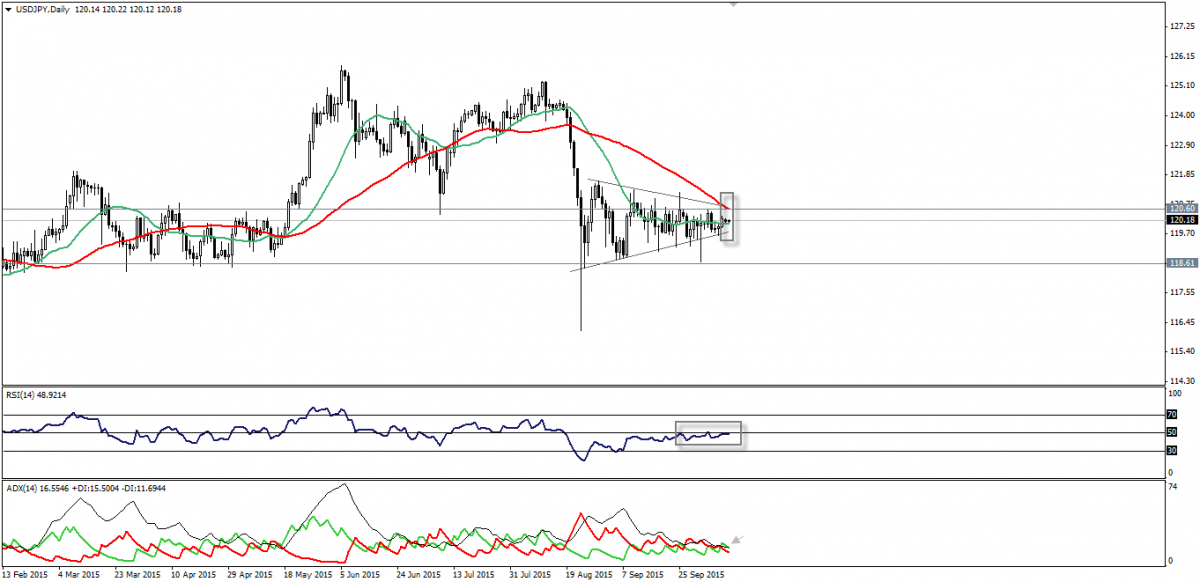
The USD/JPY remains trapped within a tight range inside the triangle pattern as seen on the provided daily chart, but we believe that these price actions could be a preparation for a strong move.

USD/JPY Daily Chart

As far as trading continues between 120.60 and 119.60, we will be on the sidelines.

We see inappropriate risk versus reward ratio and we will be patient until the USD/JPY pair breaches through one of those lines to take a position.

Technical indicators are showing signs of continuous hesitation, while prices are trapped between SMA20 and SMA50.

Support: 119-60-119.35-118.80

Resistance: 120.60-121.05-121.30

Direction: Bearish below 119.60-119.40 and bullish above 120.60, preferable 120.85.

USD/CHF

The USD/CHF has collapsed sharply last week, achieving a strong negative closing below 61.8% Fibonacci and below moving averages as seen on the provided daily chart.
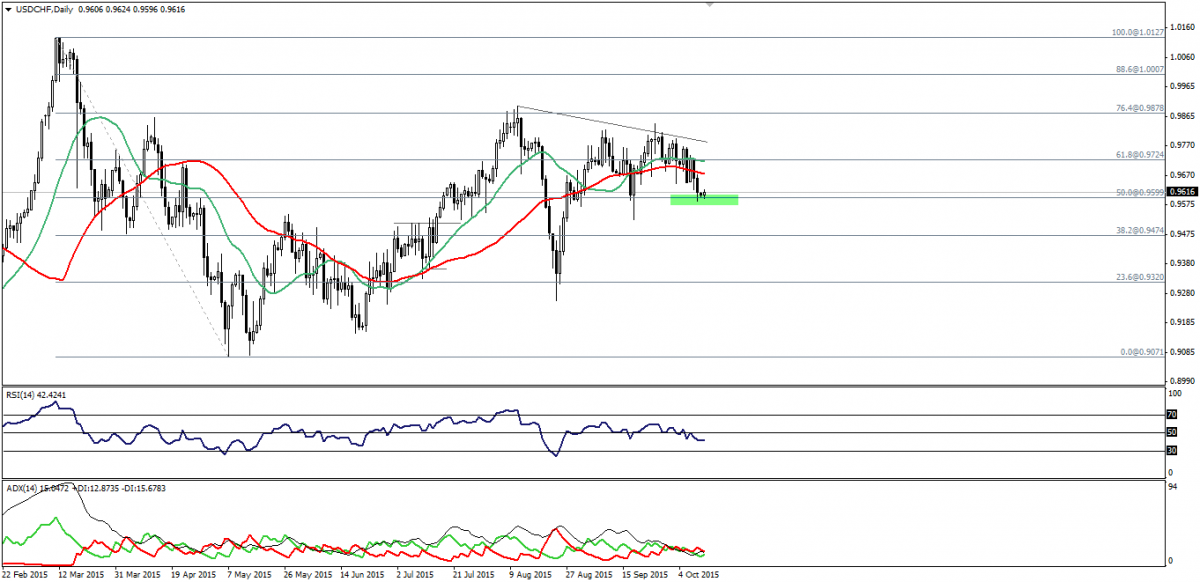
USD/CHF Daily Chart

These declines have assisted bears to form a long black candle on the weekly chart, but prices are close to 50% Fibonacci.

We need a sustained breakout below this level and preferably below 0.9585 to affirm the negativity appearing over most time frames.

Support: 0.9600-0.9530-0.9500

Resistance: 0.9685-0.9725-0.9780

Direction: Bearish below 0.9585

EUR/USD

Very weak movements are currently witnessed on EUR/USD along with weakness on ADX, while RSI stabilized below 70.00 levels, as the pair is close to 1.1385 resistance.
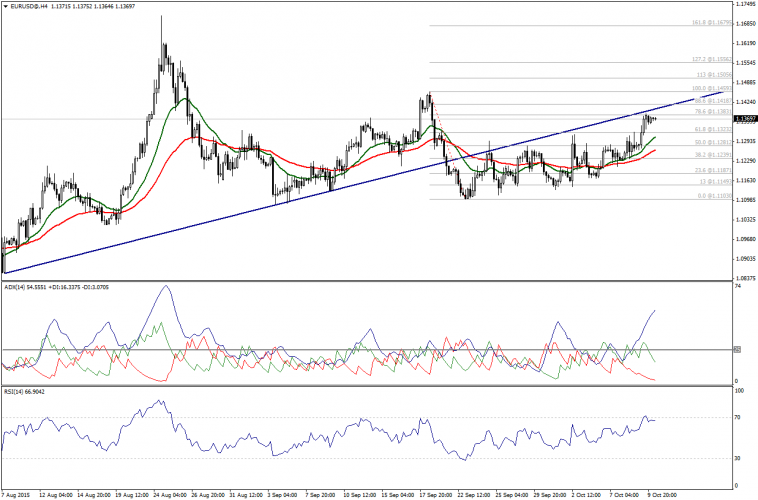
EUR/USD 4 Hour Chart

We prefer to be neutral to see what the pair will do around 1.1385 and 1.1420; noting that failure to clear 1.1420 will end the bullish move.

Support: 1.1320 – 1.1280 – 1.1240

3rd party Ad. Not an offer or recommendation by Investing.com. See disclosure here or remove ads .

Resistance: 1.1385 –1.1420 – 1.1460

Direction: Sideways, but bullish above 1.1420

GBP/USD

GBP/USD attempts to incline once again alongside bullish crossover on ADX. Trading above moving averages is a positive signal, encouraging us to be bullish, but we will avoid trading the pair until it clears 1.5385.
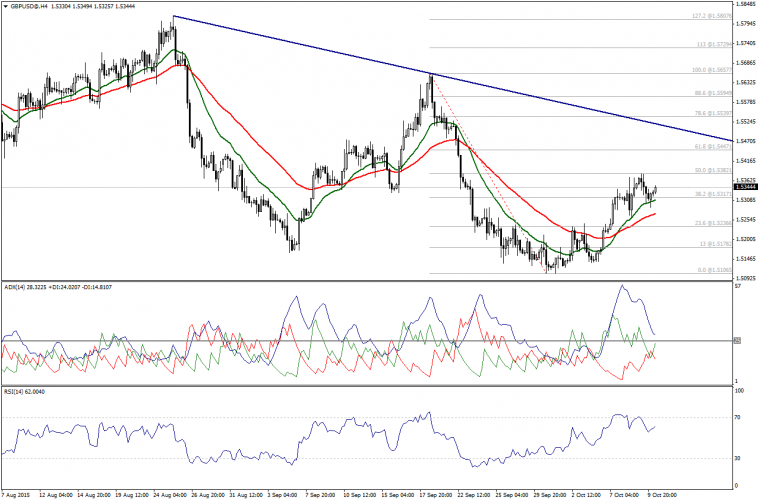
GBP/USD 4 Hour Chart

A break above this level is required to prove the strength of the bullishness and to fix the sign on RSI, which could turn into a negative divergence.

On the downside, coming below 1.5315 will negate the bullish attempts.

Support: 1.5315 – 1.5270 – 1.5235

Resistance: 1.5385 – 1.5450 – 1.5540

Direction: We will avoid trading until the pair clears 1.5385

Latest comments

Risk Disclosure: Trading in financial instruments and/or cryptocurrencies involves high risks including the risk of losing some, or all, of your investment amount, and may not be suitable for all investors. Prices of cryptocurrencies are extremely volatile and may be affected by external factors such as financial, regulatory or political events. Trading on margin increases the financial risks.
Before deciding to trade in financial instrument or cryptocurrencies you should be fully informed of the risks and costs associated with trading the financial markets, carefully consider your investment objectives, level of experience, and risk appetite, and seek professional advice where needed.
Fusion Media would like to remind you that the data contained in this website is not necessarily real-time nor accurate. The data and prices on the website are not necessarily provided by any market or exchange, but may be provided by market makers, and so prices may not be accurate and may differ from the actual price at any given market, meaning prices are indicative and not appropriate for trading purposes. Fusion Media and any provider of the data contained in this website will not accept liability for any loss or damage as a result of your trading, or your reliance on the information contained within this website.
It is prohibited to use, store, reproduce, display, modify, transmit or distribute the data contained in this website without the explicit prior written permission of Fusion Media and/or the data provider. All intellectual property rights are reserved by the providers and/or the exchange providing the data contained in this website.
Fusion Media may be compensated by the advertisers that appear on the website, based on your interaction with the advertisements or advertisers.
© 2007-2024 - Fusion Media Limited. All Rights Reserved.