Get 40% Off
👀 👁 🧿 All eyes on Biogen, up +4,56% after posting earnings. Our AI picked it in March 2024.
Which stocks will surge next?
Unlock AI-picked Stocks

USD/JPY Showing Slow Movements; USD/CHF Reaches Short-Term Target

Published 11/26/2015, 05:21 AM
Updated 07/09/2023, 06:31 AM

USD/JPY

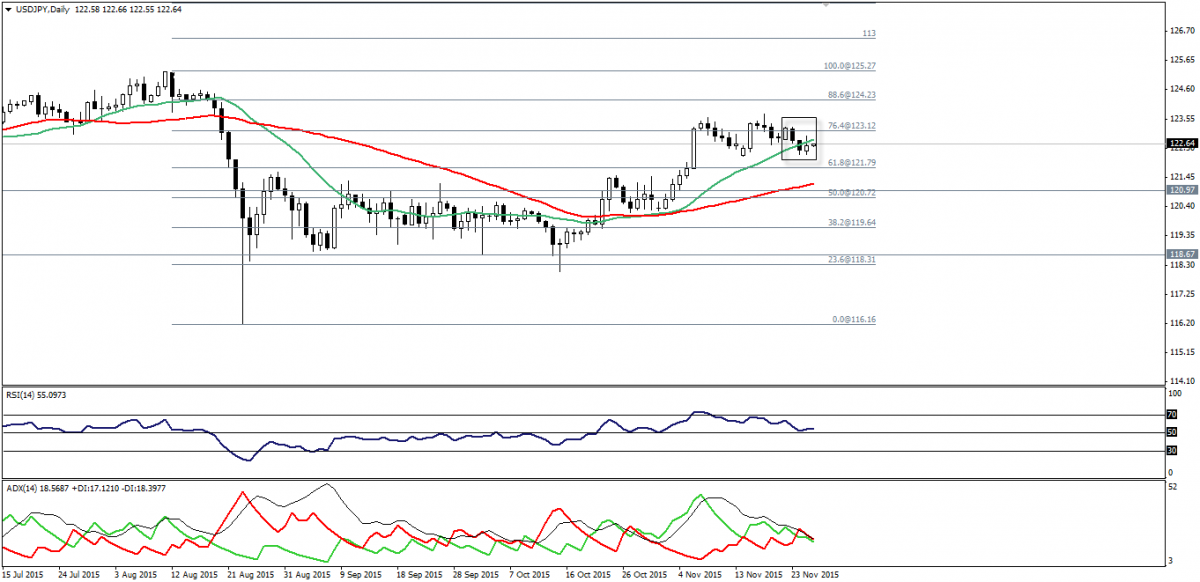
USD/JPY has showed some kind of slow movements after fluctuating slightly yesterday, but the closing was achieved below 76.4% Fibonacci and below SMA20 as seen on the provided daily chart.
USD/JPY Daily Chart

This closing may motivate traders to be bearish , but as we know the US markets will be off today and that will make the liquidity weak and risk very high.

So that, we prefer to avoid trading the USDJPY pair today; noting that, coming back below 122.30-122.20 support may weaken 121.80 Fibonacci support.

Support: 122.30-121.70-121.40

Resistance: 123.15- 123.60-123.85

Direction: Neutral

USD/CHF

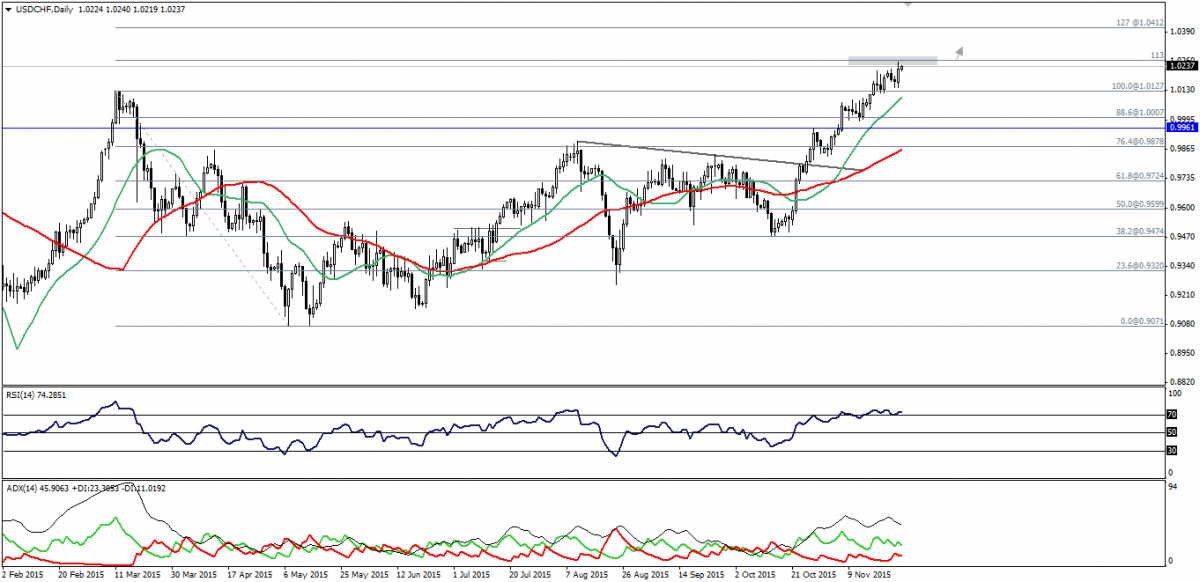
The USD/CHF has touched one of our short-term targets near 1.0260 where 113% Fibonacci exist.
USD/CHF Daily Chart

This touch for a resistance level caused some fluctuation, but didn’t change the bullishness.

It seems from the candlesticks formations that, the pair will hit the 1.0260 regions on the way towards next resistance at 1.0320 and may be 1.0410 over short-term basis.

Only coming back below 1.0150 will change the intraday bullishness, but will not change the short-term direction.

Support: 1.0200-1.0150-1.0130

Resistance: 1.0260-1.0285-1.0320

Direction: Bullish

EUR/USD

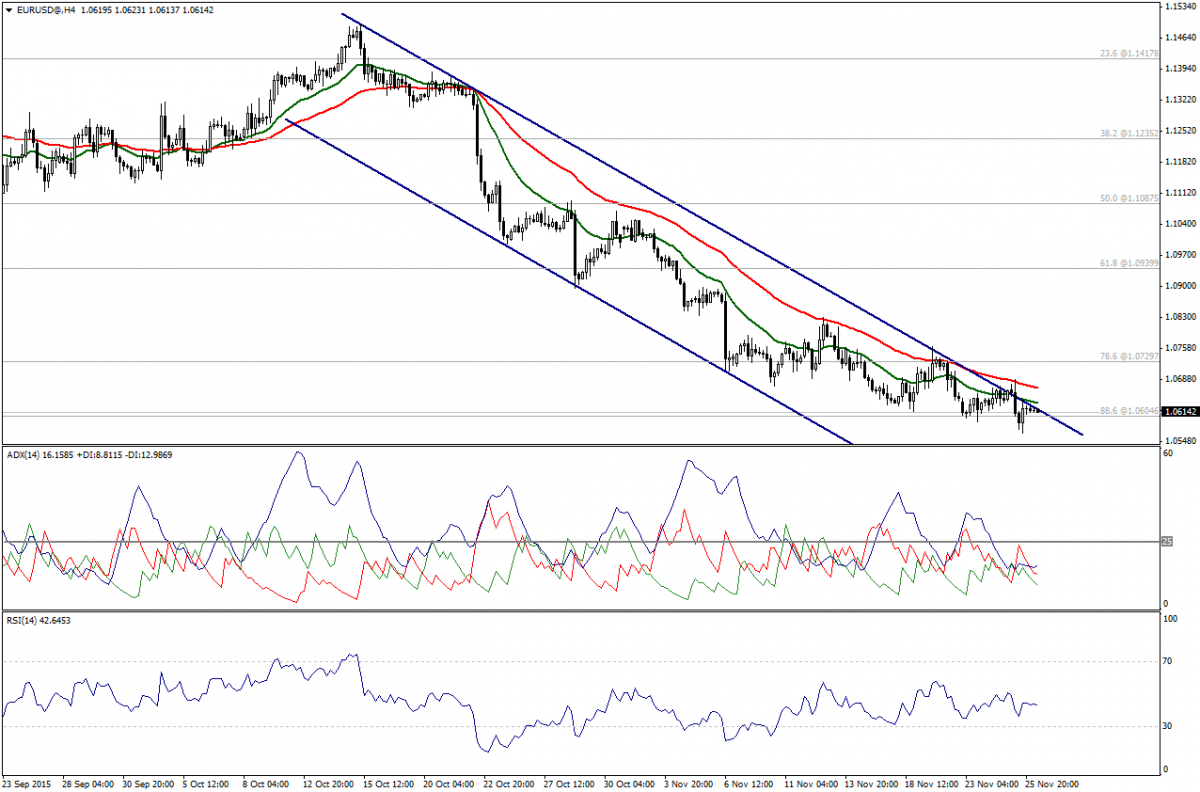
The trading range became tight since the Asian session, but the pair continues to trade below the main resistance line of the bear trend and below moving averages.
EUR/USD 4-Hour Chart

RSI14 shows weakness in the downtrend, while RSI is neutral, which argue us to wait until the pair clears 1.0600 again to affirm the bearishness.

Support: 1.0600 – 1.0570 – 1.0500

Resistance: 1.0700 –1.0730 – 1.0780

Direction: Bearish below 1.0600

GBP/USD

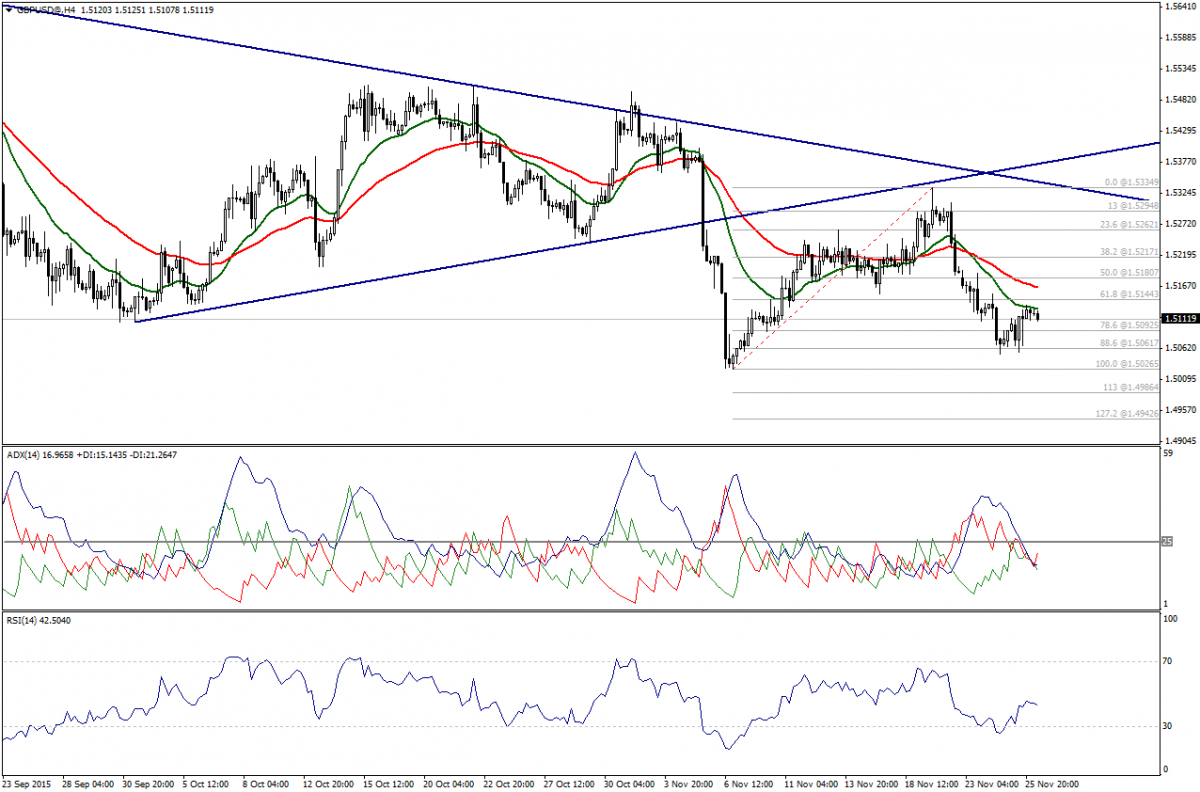
The bullish recovery seen yesterday near SMA20 didn’t change the bearish signal on ADX, while RSI14 started to move downwards below the value of 50.00.
3rd party Ad. Not an offer or recommendation by Investing.com. See disclosure here or remove ads .

GBP/USD 4-Hour Chart

Hence, we may witness a new attempt to inch lower as far as 1.5180 holds, while a break below 1.5090 will strengthens the bearish outlook.

Support: 1.5090 – 1.5060 – 1.5000

Resistance: 1.5145 – 1.5180 – 1.5220

Direction: Bearish

Latest comments

Risk Disclosure: Trading in financial instruments and/or cryptocurrencies involves high risks including the risk of losing some, or all, of your investment amount, and may not be suitable for all investors. Prices of cryptocurrencies are extremely volatile and may be affected by external factors such as financial, regulatory or political events. Trading on margin increases the financial risks.
Before deciding to trade in financial instrument or cryptocurrencies you should be fully informed of the risks and costs associated with trading the financial markets, carefully consider your investment objectives, level of experience, and risk appetite, and seek professional advice where needed.
Fusion Media would like to remind you that the data contained in this website is not necessarily real-time nor accurate. The data and prices on the website are not necessarily provided by any market or exchange, but may be provided by market makers, and so prices may not be accurate and may differ from the actual price at any given market, meaning prices are indicative and not appropriate for trading purposes. Fusion Media and any provider of the data contained in this website will not accept liability for any loss or damage as a result of your trading, or your reliance on the information contained within this website.
It is prohibited to use, store, reproduce, display, modify, transmit or distribute the data contained in this website without the explicit prior written permission of Fusion Media and/or the data provider. All intellectual property rights are reserved by the providers and/or the exchange providing the data contained in this website.
Fusion Media may be compensated by the advertisers that appear on the website, based on your interaction with the advertisements or advertisers.
© 2007-2024 - Fusion Media Limited. All Rights Reserved.