Get 40% Off
👀 👁 🧿 All eyes on Biogen, up +4,56% after posting earnings. Our AI picked it in March 2024.
Which stocks will surge next?
Unlock AI-picked Stocks

EUR/USD Trades Above 1.0605, GBP/USD Inclines

Published 12/01/2015, 04:50 AM
Updated 07/09/2023, 06:31 AM

USD/JPY

False breakout has been witnessed yesterday with moving just a few pips above 76.4% Fibonacci at 123.12 as seen on the provided chart.
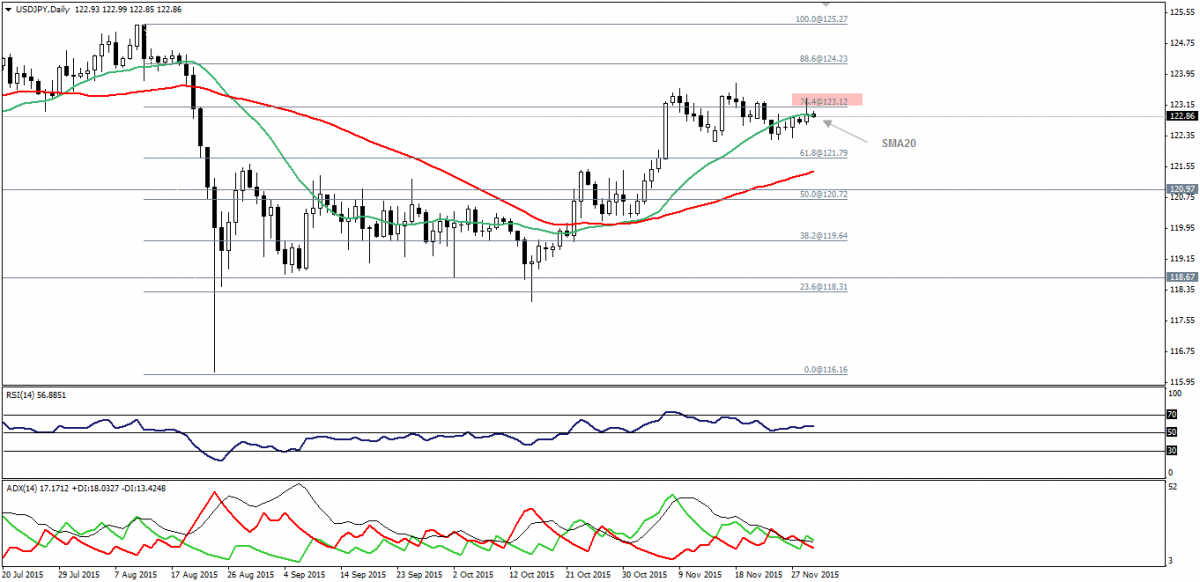
USD/JPY Daily Chart

During the Asian session, USD/JPY has retraced again below this level to currently hover around SMA20 along with weakness in the positive trend of ADX and neutral RSI.

Risk versus reward ratio remains inappropriate and thus, we will avoid trading until the pair gives of reliable signals to suggest the next big move.

Support: 122.60-122.25-121.70

Resistance: 123.15-123.65-124.10

Direction: Sideways

USD/CHF

USD/CHF has bounced from areas above 1.0300 to hover around 113% Fibonacci retracement level as seen on the provided daily.
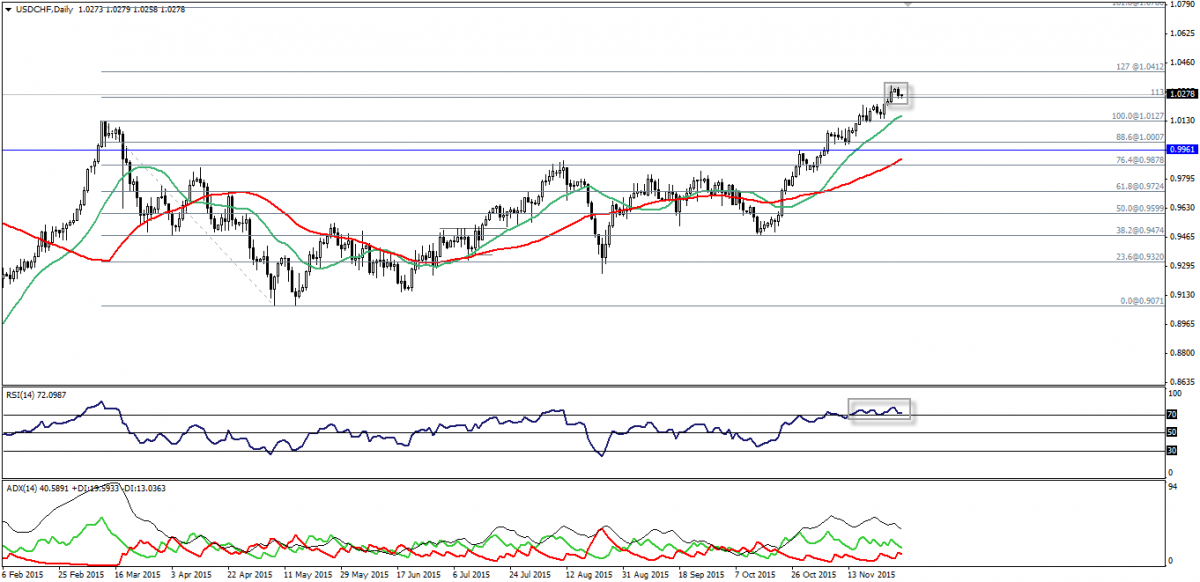
USD/CHF Daily Chart

RSI continues to give off mixed signs despite moving within overbought areas extremely.

Actually, we need to witness a breakout above 1.0330 to cancel out the effect of the overbought signal on momentum indicator.

To be prudent, we will avoid trading today to see how the pair will behave around 113% Fibonacci.

Support: 1.0260-1.0200-1.0150

Resistance: 1.0340-1.0375-1.0410

Direction: Sideways

EUR/USD

EUR/USD trades above 1.0605 and above moving averages, which is a positive signal and would bring further upside actions. Stable moves above 1.0605 will trigger bullish correction aiming to test 1.0700 and 1.0730 with a break above 1.0660.

Protection for the scenario resides at 1.0530.

December trading started with bullish attempts on EUR/USD, but still movements are capped by moving averages and below the main resistance.
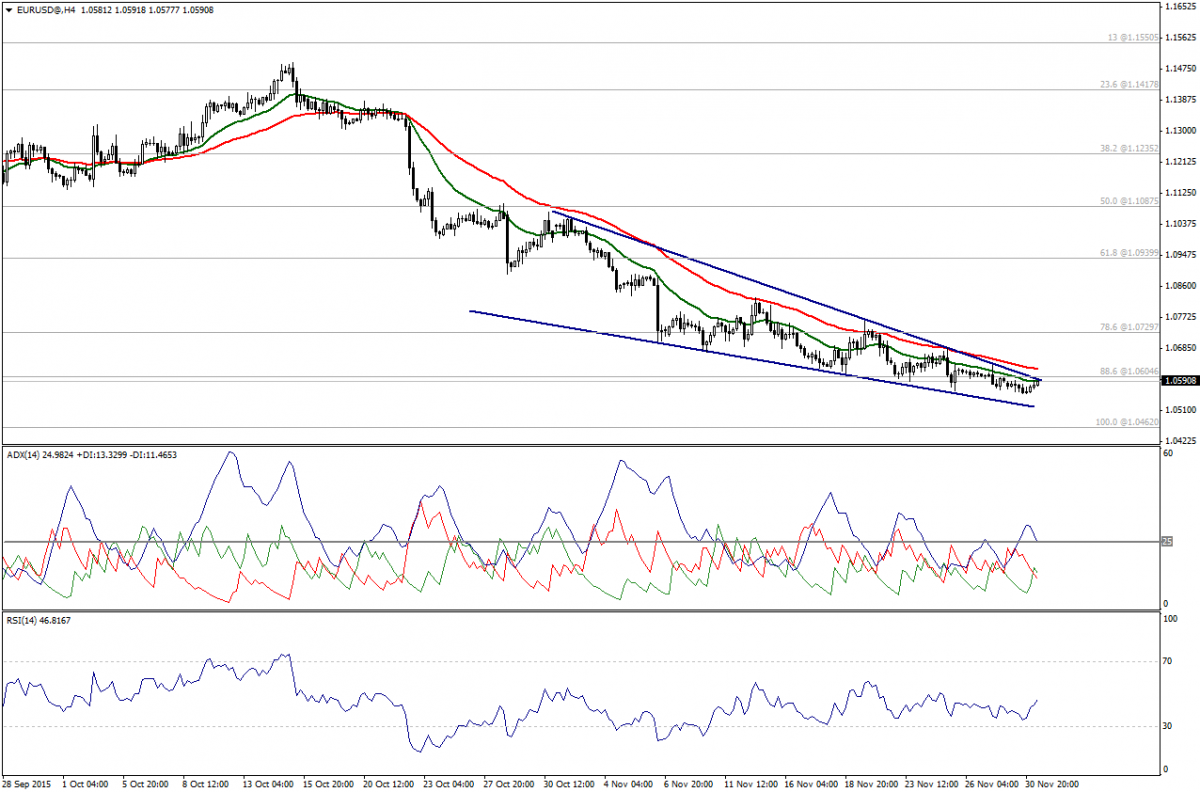
EUR/USD 4 Hour Chart

ADX shows positive signal and also RSI, which contradicts with the stability below moving averages.

3rd party Ad. Not an offer or recommendation by Investing.com. See disclosure here or remove ads .

We will be neutral until a new signal appears; noting that, a break above 1.0605 and 1.0570 are important levels for intraday trading.

Support: 1.0570 – 1.0520 – 1.0460

Resistance: 1.0605 –1.0660 – 1.0730

Direction: Sideways

GBP/USD

GBP/USD inclined, trading around 1.5090, but still capped by moving average 50 as seen on the graph.
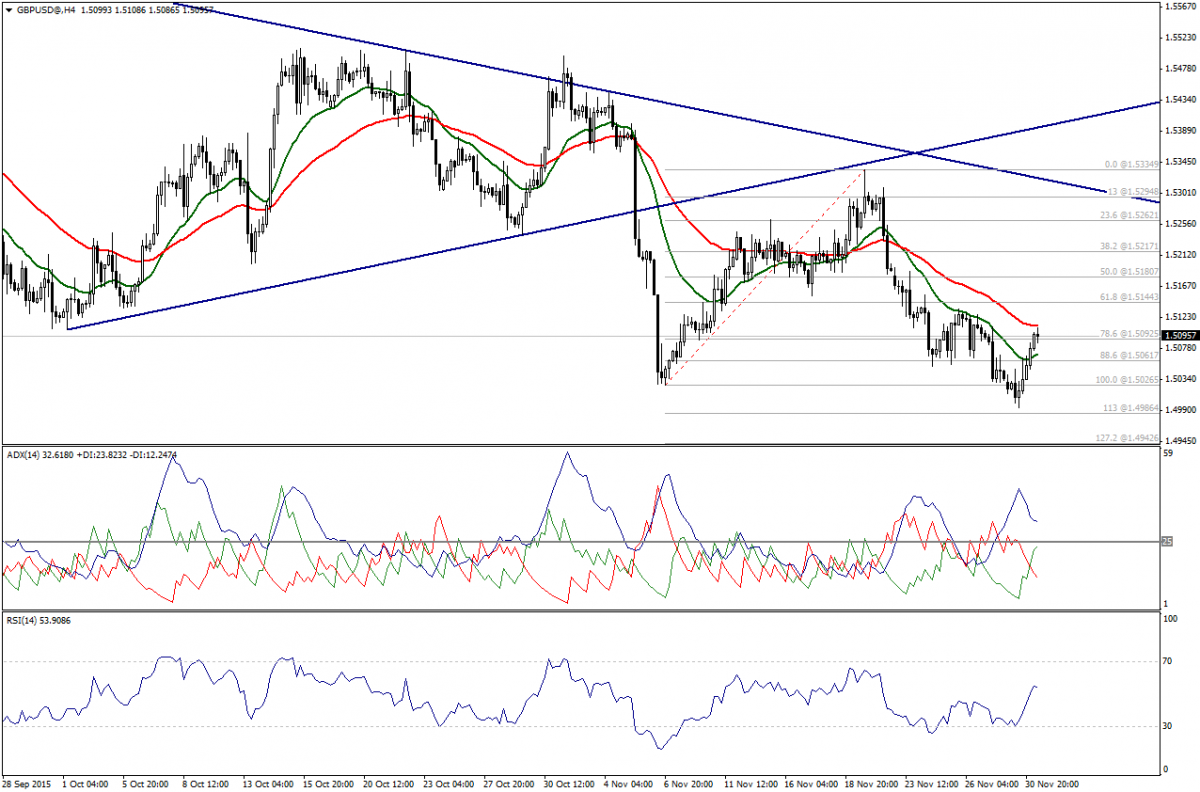
GBP/USD 4 Hour Chart

Some kind of positivity appears on ADX, which contradicts with moving below SMA50. We can’t say that the bearishness is over and thus, we need to wait until new signals appear to pinpoint the next move.

Support: 1.5060 – 1.5025 – 1.4985

Resistance: 1.5100 – 1.5145 – 1.5180

Direction: Sideways

Latest comments

Risk Disclosure: Trading in financial instruments and/or cryptocurrencies involves high risks including the risk of losing some, or all, of your investment amount, and may not be suitable for all investors. Prices of cryptocurrencies are extremely volatile and may be affected by external factors such as financial, regulatory or political events. Trading on margin increases the financial risks.
Before deciding to trade in financial instrument or cryptocurrencies you should be fully informed of the risks and costs associated with trading the financial markets, carefully consider your investment objectives, level of experience, and risk appetite, and seek professional advice where needed.
Fusion Media would like to remind you that the data contained in this website is not necessarily real-time nor accurate. The data and prices on the website are not necessarily provided by any market or exchange, but may be provided by market makers, and so prices may not be accurate and may differ from the actual price at any given market, meaning prices are indicative and not appropriate for trading purposes. Fusion Media and any provider of the data contained in this website will not accept liability for any loss or damage as a result of your trading, or your reliance on the information contained within this website.
It is prohibited to use, store, reproduce, display, modify, transmit or distribute the data contained in this website without the explicit prior written permission of Fusion Media and/or the data provider. All intellectual property rights are reserved by the providers and/or the exchange providing the data contained in this website.
Fusion Media may be compensated by the advertisers that appear on the website, based on your interaction with the advertisements or advertisers.
© 2007-2024 - Fusion Media Limited. All Rights Reserved.