Get 40% Off
🤯 Perficient is up a mind-blowing 53%. Our ProPicks AI saw the buying opportunity in March.Read full update

Daily Shot: Is Europe Getting Ahead Of Itself?

Published 05/19/2015, 05:53 AM
Updated 07/09/2023, 06:31 AM

Let's start with US energy markets where oil and gas drilling activity has collapsed.
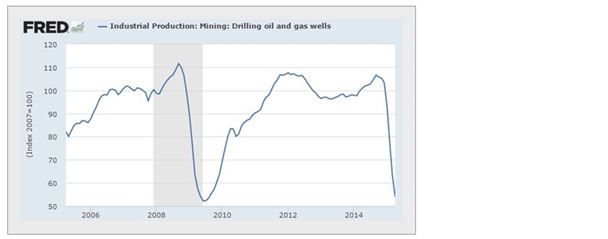
Drilling Oil and Gas Chart

While this decline in drilling is a bullish sign for crude oil, it's important to note that the oil cost curve continues to shift lower, with capacity extending further out. That's why it is difficult to see how WTI can be sustained materially above $60/barrel where significant capacity can be quickly brought back online.
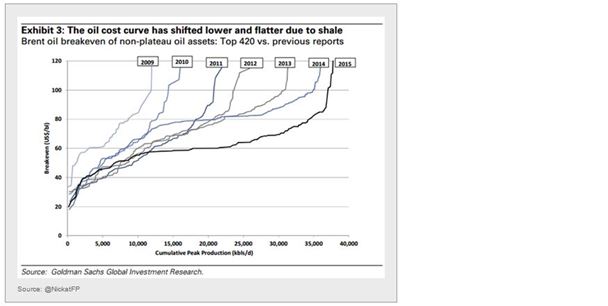
Oil Cost Curve Chart
Switching to the Eurozone, we see a dramatic shift in timing expectations for the first European Central Bank hike. We went from 57 months until the first expected hike to just over 30 months in a matter of days.
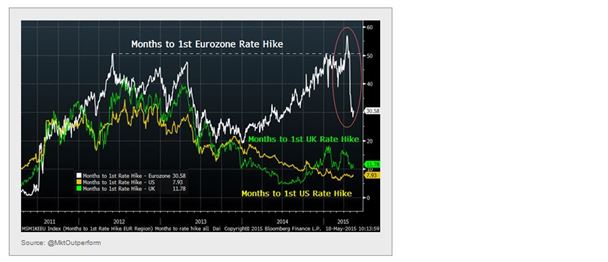
ECB Hike Chart

This shift is driven by the recent selloff in sovereign bonds, in part due to improved expectations for Eurozone growth.
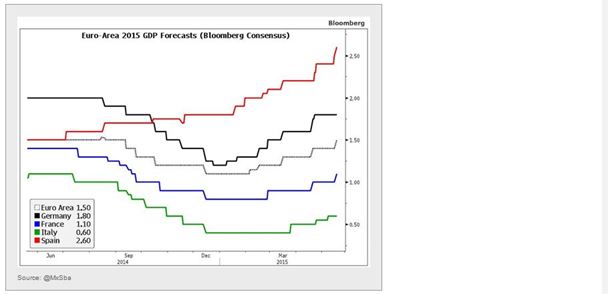
Euroarea GDP Forecast Chart

However, many analysts point out that this correction is likely overdone, as the lack of paper – particularly German government bonds – will push yields lower.
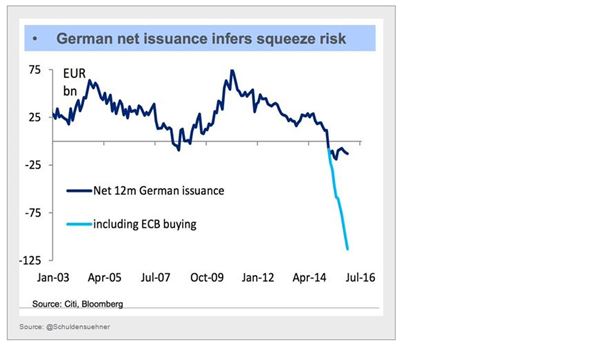
German Net Issuance Chart

This yield compression will likely be helped by the ongoing uncertainty around Greece, where a compromise with the creditors remains elusive. Greek bond yields are beginning to rise again.
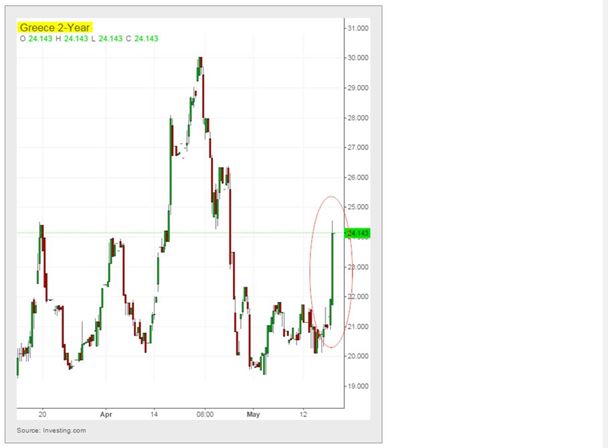
Greece Two-Year Chart
Ukrainian industrial production is declining by more than 20% on a year-over-year basis.
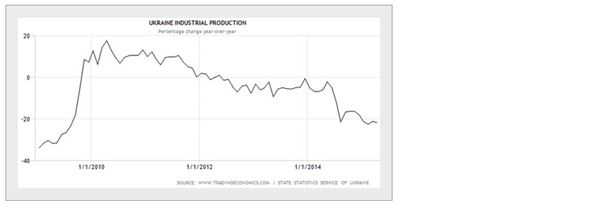
Ukraine Industrial Production Chart

Part of the issue is the nation's declining exports to Russia, while trade with EU remains flat. Those lost sales, especially for industrial products and aircraft, will be impossible to replace.
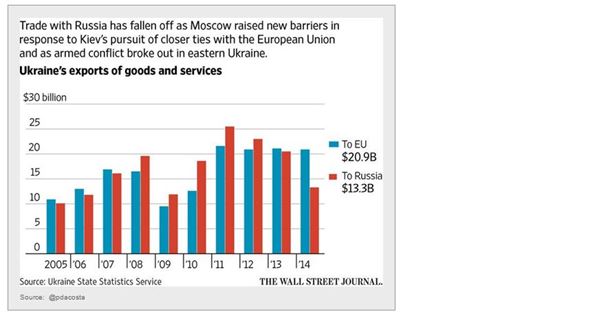
Ukraine Trade Chart
Margin leverage in China's equity markets continues to rise. Macquarie pointed out recently that, "this could already be the highest level of margins versus free float in market history." Meanwhile, the Shanghai Composite is back above 4,400 – up 2.7% this morning.
Chinese Equities Chart
In spite of somewhat firmer real estate prices in China, the volume of land purchases and property development growth continue to decline. This does not look great for the shares of nation's developers.
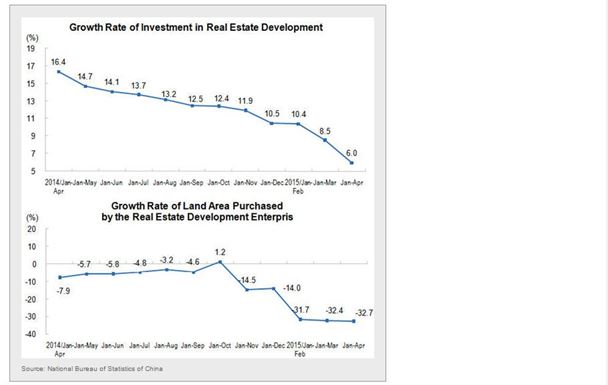
Land Purchases Chart
Now some food for thought...

3rd party Ad. Not an offer or recommendation by Investing.com. See disclosure here or remove ads .

Italy's economic gap between the nation's north and south is striking.
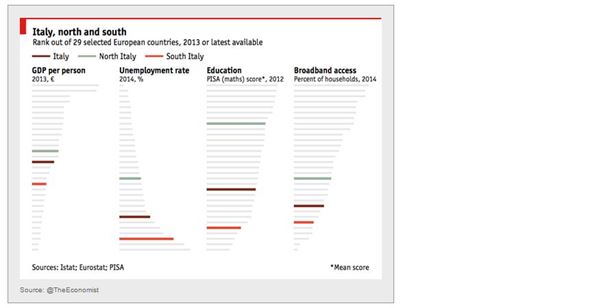
Italy Economic Gap Chart

Disclosure: Originally published at Saxo Bank TradingFloor.com

Latest comments

Risk Disclosure: Trading in financial instruments and/or cryptocurrencies involves high risks including the risk of losing some, or all, of your investment amount, and may not be suitable for all investors. Prices of cryptocurrencies are extremely volatile and may be affected by external factors such as financial, regulatory or political events. Trading on margin increases the financial risks.
Before deciding to trade in financial instrument or cryptocurrencies you should be fully informed of the risks and costs associated with trading the financial markets, carefully consider your investment objectives, level of experience, and risk appetite, and seek professional advice where needed.
Fusion Media would like to remind you that the data contained in this website is not necessarily real-time nor accurate. The data and prices on the website are not necessarily provided by any market or exchange, but may be provided by market makers, and so prices may not be accurate and may differ from the actual price at any given market, meaning prices are indicative and not appropriate for trading purposes. Fusion Media and any provider of the data contained in this website will not accept liability for any loss or damage as a result of your trading, or your reliance on the information contained within this website.
It is prohibited to use, store, reproduce, display, modify, transmit or distribute the data contained in this website without the explicit prior written permission of Fusion Media and/or the data provider. All intellectual property rights are reserved by the providers and/or the exchange providing the data contained in this website.
Fusion Media may be compensated by the advertisers that appear on the website, based on your interaction with the advertisements or advertisers.
© 2007-2024 - Fusion Media Limited. All Rights Reserved.