Recession talk is fast and loose these days, but a fair amount of the chattering on this topic is anecdotal. Fortunately, there are a number of superior (i.e, relatively objective) metrics to consider based on hard data and robust modeling, including one technique that shows up regularly on The Capital Spectator (see last month’s update). Even if you’re adhering to best practices, there’s still the problem of a time lag. In some cases, we have to wait a month or two before we see fresh figures for a given indicator, which is usually reflecting some period in recent history. There’s also the matter of revisions to consider. Signals can change as updates for previously released numbers are published. One way to bridge the gap is with market data, which are available in real-time and immune to revisions.
Market signals aren’t perfect, of course, but as the following example shows this is a powerful way to monitor recession risk on a daily basis. Ideally, this methodology should be used in context with other techniques. But as a first approximation for monitoring macro danger signs, modeling market prices provides some obvious benefits.
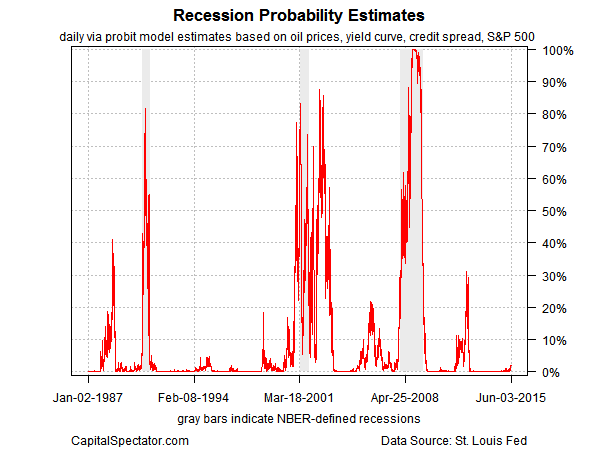
The chart below tracks a daily estimate of recession-risk probability for the US economy by way of a probit model based on four market prices that collectively have a history of dispensing timely and reliable signals about the business cycle: the US stock market (S&P 500); the Treasury yield curve (10-year yield less the effective Fed funds rate); the credit spread (BAA-rated bond yields less AAA yields), and crude oil prices (based on the US benchmark, West Texas Intermediate). The results can be noisy at times, but as you can see this methodology has done a decent job of issuing relatively early warnings when the US economy was sliding into a recession.

In the last three recessions (defined by NBER’s dating system), the model’s risk estimate rose above the 50% threshold relatively early. For example, in the last two months of 2007, the below-20% readings that had prevailed for several years began to rise, moving above the 50% mark in mid-January 2008 (a month that NBER would eventually label as the first recessionary month). In the months to come, the model’s signals bounced around in the roughly 40%-to-60% range, shooting up to around 80% in late-August. That jump came just ahead of the Sep. 15 news that turned out to be the last straw that broke the camel’s back, so to speak: the collapse of Lehman Brothers.
By the time the news about Lehman hit the streets, the jig was up. But the fact that a markets-based model had been issuing dire warnings since the beginning of the year is a reminder that a fair amount of the guesswork that passes as business-cycle analysis can be and should be replaced with a robust algorithm (or two or three). The reasoning, by the way, for choosing these markets is discussed in some detail in my recent book on analyzing the US business cycle.
As for the initial warning signal that this model issued in Jan. 2008, let’s recognize that there was still a widely held view at the time that the economy, while under a degree of strain, would somehow muddle through. A market-based model suggested otherwise.
There’s a caveat, of course: market prices aren’t destined to issue flawless warnings in the future, an observation that applies to every model. There’s also the potential for noise from time to time. In the chart above, note the spike to around 40% in late-1987, which reflects the dramatic stock market crash in Oct. of that year. More recently, the model dispensed elevated readings at around the 30% mark at various points in mid-2012. Around this time, some economists argued that a new recession was fate. But while business cycle risk had increased, it didn’t pass the critical 50% threshold. As it turned out, the economy averted a recession, based on NBER data.
Yes, looking for reliable recession signals in real time will always be a messy affair and there are no silver bullets. But market signals deserve to be part of the tool kit for monitoring the biggest known risk factor.
On that note, the model’s current estimate of recession risk is low, roughly 2% as of Jun. 3. But that’s not written in stone. Indeed, history reminds that this risk estimate can change quickly. Then again, you’ll never know if it changes and moves into the red zone if you’re not monitoring the signals through an econometrically relevant prism.
