
The USD is clearly reacting to strong US economic news, contrary to what was happening late last year. This confirms to me that the rally in the EUR/USD in December was seasonal and probably influenced by repatriation by banks ahead of the Asset Quality Review this year. Thus yesterday’s action makes me even more confident in my bullish view on the dollar in 2014.
The euro yesterday failed to rally even after German factory orders exceeded expectations, Eurozone retail sales rose the most in 12 years and peripheral bond yields continued to decline, signaling increased confidence in the region. By contrast, yesterday’s ADP employment report was even stronger than anticipated and encouraged those market participants who are expecting strong growth from the US this year. The 10-year Treasury yield gained 5 bps and the implied interest rate on 2016 Fed Funds futures added a sharp 9 to 13 bps. Subsequently the minutes of the December FOMC meeting added little to our knowledge of Fed thinking beyond what outgoing Chairman Bernanke had said at his press conference following the meeting. Nonetheless the dollar continued to move higher, albeit slowly, and this morning in early European time it’s higher than it was this time yesterday against all the G10 currencies except the pound. GBP was the best performing G10 currency yesterday after the Bank of England said mortgage availability increased in Q4 last year and will continue to rise as the government’s plan to help first-time buyers improves access to mortgages. The dollar has also gained against most of the EM currencies we track too.
During the European day, BoE and ECB hold their monetary policy meetings. The market expects no changes from either bank, so the focus will be on the press conference held by ECB’s President Mario Draghi and his comments about taking any action the following months if necessary, especially after the slowdown in Eurozone’s CPI figures on Tuesday. The EUR/USD tends to be quite volatile on days when there is an ECB meeting even when there is no change in policy – almost twice the normal volatility last year -- and I would recommend caution in taking positions ahead of the meeting or indeed immediately afterwards.
For example, last June there was a 1.8% daily range on the EUR/USD on the day of the ECB meeting even though they made no change, the same as the range in November, when they did surprise the market with a change (although admittedly that was the most extreme example of the year – the average range on ECB days was 1.3%.) My expectation is that once again Draghi says that they stand ready to take further measures than necessary, but given his recent statements I’d expect him to stress that the economy is moving as they envision and they do not see further steps as necessary at this point. That could give EUR some temporary support and provide opportunities to establish new short positions. As the graph shows, on average the EUR/USD last year tended to move higher on days when there was no change in policy, and it rose significantly following the December meeting (although that may have also included year-end factors as mentioned above).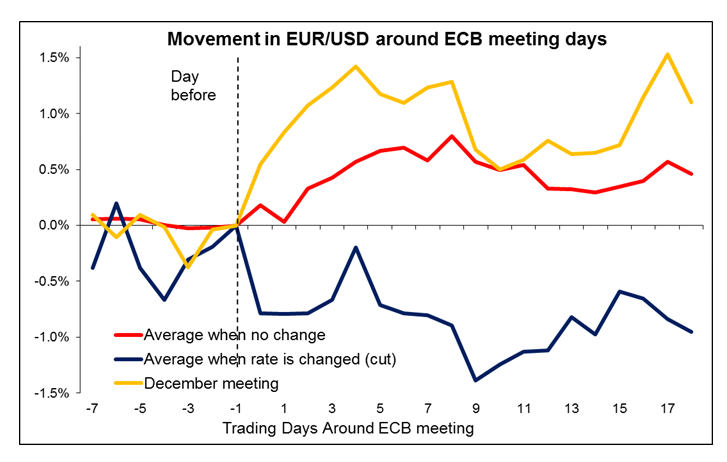 EUR/USD Around ECB Meeting" title="Movement In EUR/USD Around ECB Meeting" width="452" height="463">
As for the Bank of England meeting, those have tended to be non-events ever since the new system of forward guidance went into effect, as the graph shows. We could envision them lowering their unemployment target as the economy is recovering faster than expected even while inflation falls also faster than expected. That would likely be negative for GBP, but we do not put a high probability on such a move.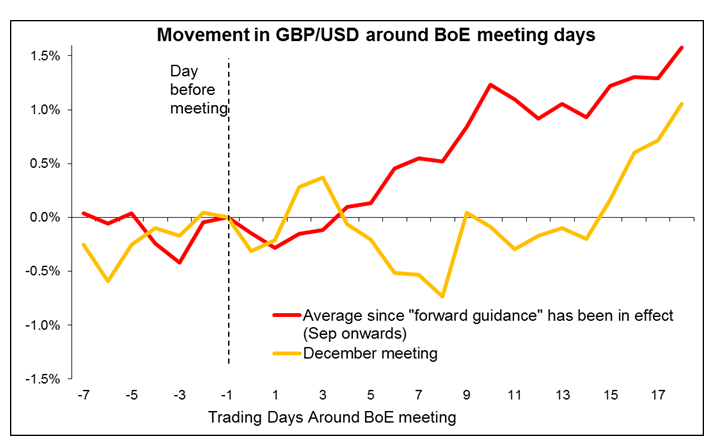 GBP/USD around BoE Meeting" title="Movement In GBP/USD around BoE Meeting" width="452" height="463">
As for the indicators, the UK trade deficit for November is estimated to have continued narrowing to GBP 2.3bn from GBP 2.6bn in October, although this is not likely to be market-affecting as so far the huge trade deficit has done nothing to prevent GBP strength. Eurozone releases its final data on consumer confidence for December. It’s expected to be unchanged from the initial estimate at -13.6, higher than the -15.4 in November. From Germany, industrial production for November is forecast to have risen 1.5%, a turnaround from -1.2% on October.
In Canada, housing starts are forecast at 190.0k SAAR in December, down from 192.2k in November, while building permits are estimated to have fallen 2.7% mom in November vs a 7.4% mom rise in October. The country’s new housing price index is expected to have risen a modest 0.1%, the same pace as in the previous month. CAD has been quite weak recently and these indicators give further evidence that a rate hike is nowhere in sight. Long GBP/CAD might be worth looking into for investors interested in riding this trend.
The only indicator coming out from US is the weekly jobless claims for Jan 4. Market expects that 335k individuals applied for their unemployment benefits vs 339k the previous week. This would probably not be market-affecting.
The Market
EUR/USD 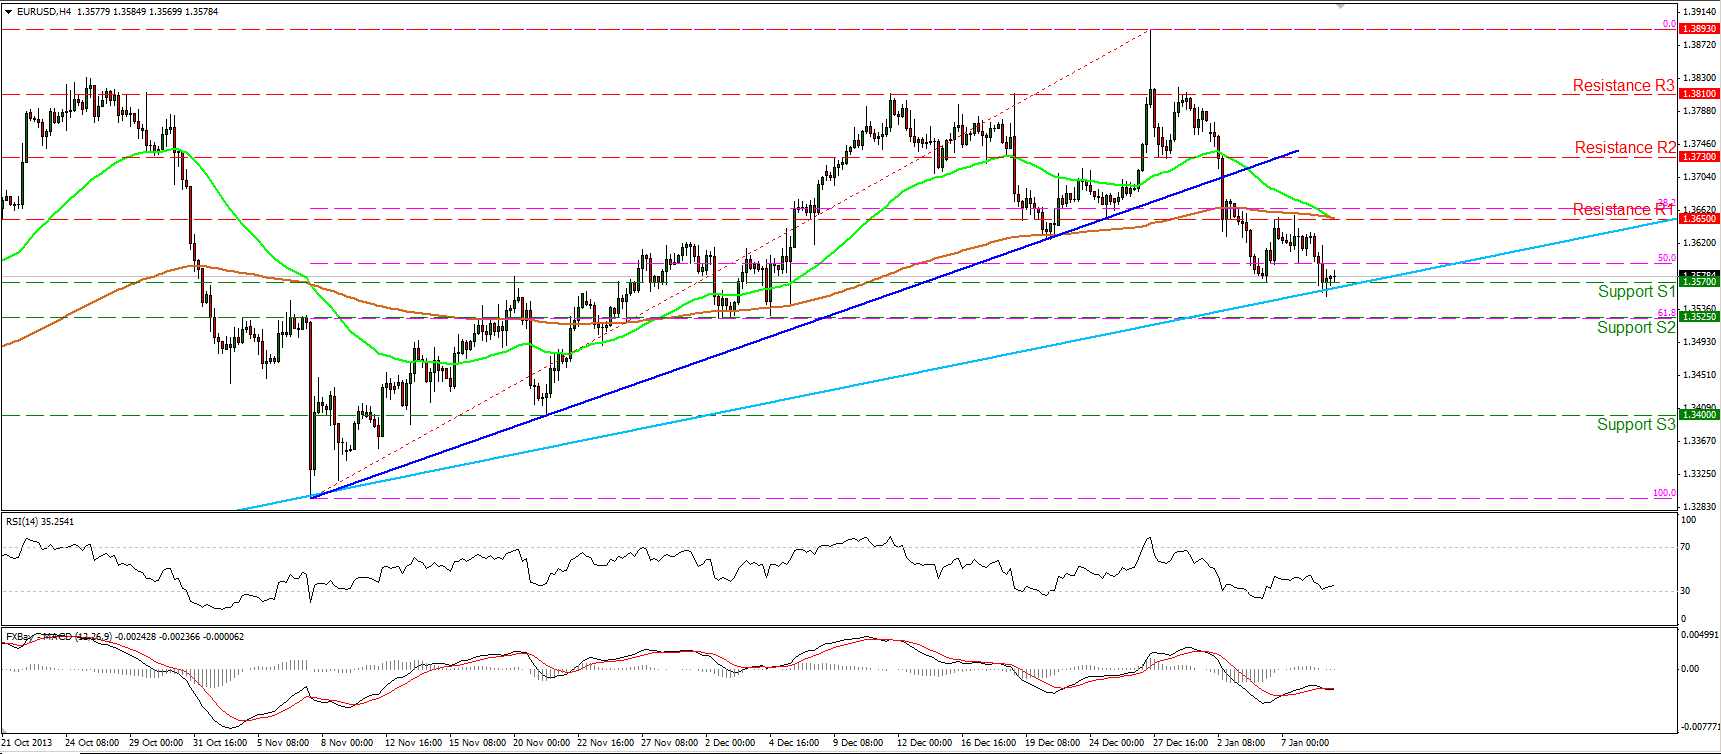 EUR/USD 4 Hour Chart" title="EUR/USD 4 Hour Chart" width="452" height="463">
The EUR/USD moved lower on Wednesday, reaching the support barrier of 1.3570 (S1) and the long-term uptrend line (light blue line). A break below the light blue support line followed by a dip below the 1.3525 (S2) key support may challenge as a first target the next support at 1.3400 (S3). The 1.3525 (S2) level coincides with the 61.8% Fibonacci retracement level of the prevailing short-term uptrend, thus it may not be so easy to break that level. On the other hand, a rebound at the light blue trend line, followed by a rise above 1.3650 (R1), will keep the longer-term uptrend intact. The 50-period moving average seems ready to cross below the 200-period moving average and on the daily chart, we can identify negative divergence between the daily MACD and the price action, indications that give more weight to the first (bearish) scenario.
• Support: 1.3570 (S1), 1.3525 (S2), 1.3400 (S3).
• Resistance: 1.3650 (R1), 1.3730 (R2), 1.3810 (R3).
EUR/JPY EUR/JPY 4 Hour Chart" title="EUR/JPY 4 Hour Chart" width="452" height="463">
The EUR/JPY moved lower after finding resistance at 143.15 (R1). The 200-period moving average remains near the 140.88 (S1) support, thus a downward break of that area may have larger bearish implications. On the other hand, a rebound near that area may target once again the highs of 145.00 (R2). On the daily and weekly charts the longer term uptrend is still impact, thus I would consider any short-term decline as retracement of the long-term upward path.
• Support: 140.88 (S1), 139.67 (S2), 138.00 (S3).
• Resistance: 143.15 (R1), 145.00 (R2), 147.00 (R3).
GBP/USD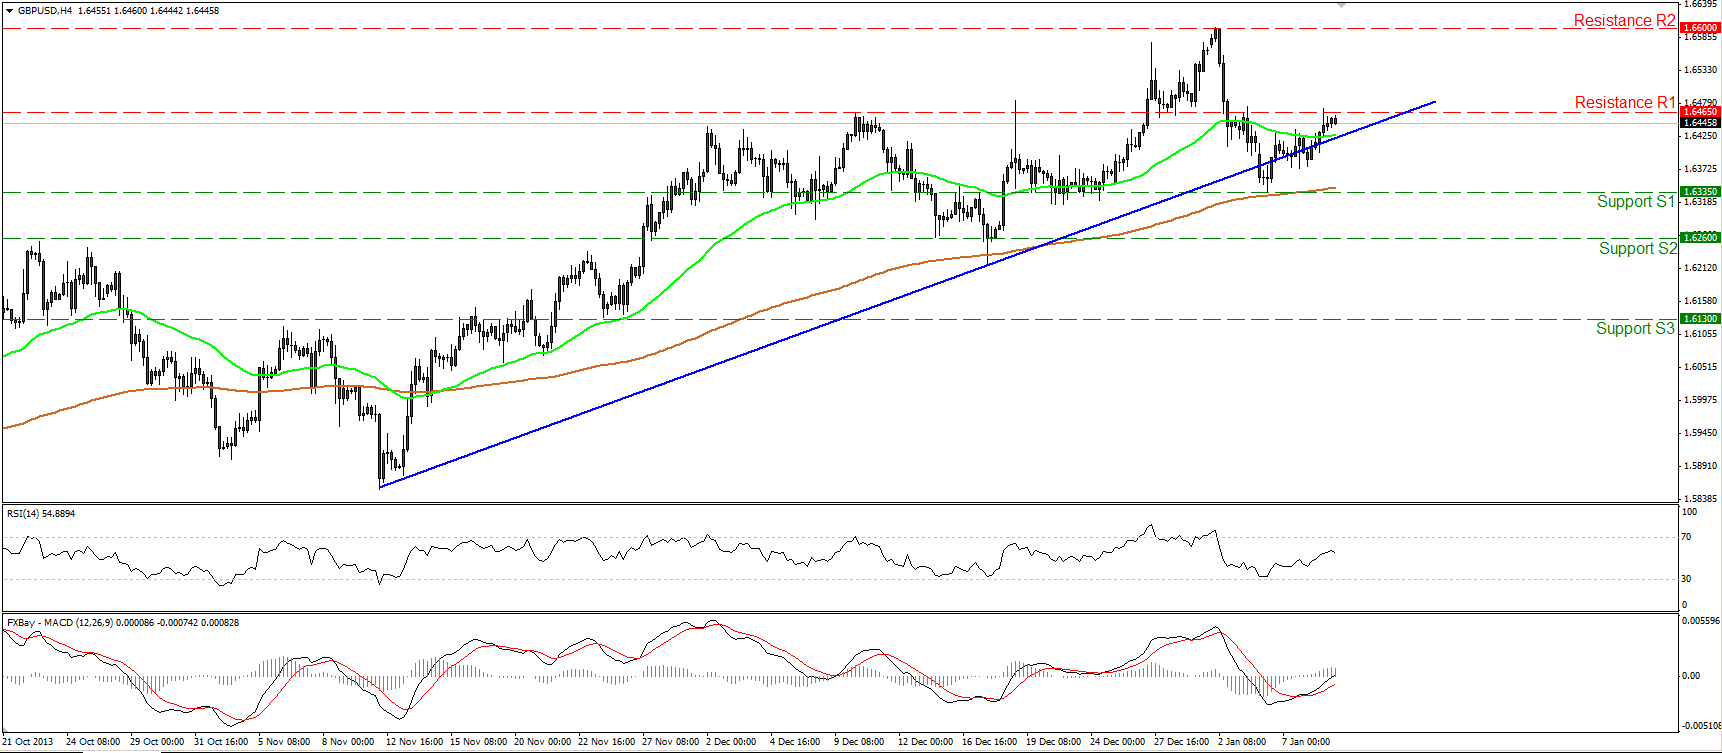 GBP/USD 4 Hour Chart" title="GBP/USD 4 Hour Chart" width="452" height="463">
THe GBP/USD moved higher after finding support at 1.6335 (S1) and the 200-period moving average. At the time of writing, the pair is testing the resistance hurdle of 1.6465 (R1), where an upward break may target once again the highs of 1.6600 (R2). A dip below the 1.6335 (S1) is needed to turn the short term picture negative. My worries for now is that on the daily chart, we can identify negative divergence between the daily MACD and the price action. This suggests that the longer-term uptrend is losing momentum for now.
• Support: 1.6335 (S1), 1.6260 (S2), 1.6130 (S3).
• Resistance: 1.6465 (R1), 1.6600 (R2), 1.6735 (R3).
Gold
Gold moved slightly higher after rebounding near the 1224 (S1) support level. The yellow metal is now trading slightly above that support where a dip may target the recent lows of 1187 (S2). On the other hand an upward violation of the 1251 (R1) barrier may turn the short term bias to the upside. I still consider the short term picture neutral, but on the daily and weekly charts, the longer-term downtrend remains impact.
• Support: 1224 (S1), 1187 (S2), 1155 (S3).
• Resistance: 1251 (R1), 1268 (R2), 1290 (R3).
Oil
WTI fell sharply after confirming the validity of the 94.00 (R1) resistance hurdle. The price is now trading slightly above the floor of 92.00 (S1). I expect the price to find strong support near that level and consolidate for some time before taking its next directional path. The last time WTI rebounded from 92.00 (S1), the price rallied towards 97.25 (R3). Nonetheless, if the 92.00 (S1) level fails to hold this time, we may experience extensions towards the next support barrier at 90.15 (S2). The 50-period moving average lies below the 200-peroid moving average, keeping the outlook of the oil negative at the moment.
• Support: 92.00 (S1), 90.15 (S2), 87.85 (S3).
• Resistance: 94.00 (R1), 95.35 (R2), 97.25 (R3).
BENCHMARK CURRENCY RATES - DAILY GAINERS AND LOSERS
MARKETS SUMMARY
- English (UK)
- English (India)
- English (Canada)
- English (Australia)
- English (South Africa)
- English (Philippines)
- English (Nigeria)
- Deutsch
- Español (España)
- Español (México)
- Français
- Italiano
- Nederlands
- Português (Portugal)
- Polski
- Português (Brasil)
- Русский
- Türkçe
- العربية
- Ελληνικά
- Svenska
- Suomi
- עברית
- 日本語
- 한국어
- 简体中文
- 繁體中文
- Bahasa Indonesia
- Bahasa Melayu
- ไทย
- Tiếng Việt
- हिंदी
Daily Commentary: USD Gaining On Solid Fundamentals
Published 01/10/2014, 01:10 AM
Updated 12/18/2019, 06:45 AM
Daily Commentary: USD Gaining On Solid Fundamentals
3rd party Ad. Not an offer or recommendation by Investing.com. See disclosure here or
remove ads
.
Latest comments
Install Our App
Risk Disclosure: Trading in financial instruments and/or cryptocurrencies involves high risks including the risk of losing some, or all, of your investment amount, and may not be suitable for all investors. Prices of cryptocurrencies are extremely volatile and may be affected by external factors such as financial, regulatory or political events. Trading on margin increases the financial risks.
Before deciding to trade in financial instrument or cryptocurrencies you should be fully informed of the risks and costs associated with trading the financial markets, carefully consider your investment objectives, level of experience, and risk appetite, and seek professional advice where needed.
Fusion Media would like to remind you that the data contained in this website is not necessarily real-time nor accurate. The data and prices on the website are not necessarily provided by any market or exchange, but may be provided by market makers, and so prices may not be accurate and may differ from the actual price at any given market, meaning prices are indicative and not appropriate for trading purposes. Fusion Media and any provider of the data contained in this website will not accept liability for any loss or damage as a result of your trading, or your reliance on the information contained within this website.
It is prohibited to use, store, reproduce, display, modify, transmit or distribute the data contained in this website without the explicit prior written permission of Fusion Media and/or the data provider. All intellectual property rights are reserved by the providers and/or the exchange providing the data contained in this website.
Fusion Media may be compensated by the advertisers that appear on the website, based on your interaction with the advertisements or advertisers.
© 2007-2024 - Fusion Media Limited. All Rights Reserved.