
Active right to the end
The end of the year is usually a placid time for markets, but this year there have been some dramatic moves right down to the end. The range for the year in USD/SEK was 9.4% (from 6.2732 to 6.8654), but just yesterday the range was 2.0% or 21% of the entire year’s range. Similarly with NOK, the range for the year was 15.5% and the spread yesterday was 1.5% or 10% of the entire year’s range in one day. NZD/USD also had a 1.3% range yesterday, quite substantial within the context of a 12.9% range for the year. In Sweden’s case the movement was clearly related to the news flow (higher-than-expected Swedish retail sales in November) but the sharp moves in other currencies suggest that something more widespread is afoot.
True, yesterday’s US pending home sales figure was somewhat disappointing, but overall the US economic indicators remain not only broadly positive but far more surprisingly positive than in most other countries, and that’s usually what counts (see top graph). Also the implied rates on Fed Funds futures have come down slightly – they peaked last Thursday and are down 5-6 bps in the 2016 region since then, but this is still substantially higher – 17 to 27 bps – than before the FOMC meeting on 18 Dec (bottom graph). Yet the dollar is quite mixed since then, up against four of its G10 counterparts (JPY, NZD, CAD and CHF) and down vs four (SEK, NOK, GBP and EUR). (It’s unchanged vs AUD.) 
Why has the announcement of tapering, the better-than-expected US economic indicators and the sharp upward revision to Fed Funds expectations failed to boost the dollar? This goes against all fundamental logic. I can only surmise that this is end-of-year distortions. Over the last five years, the dollar has on average weakened in December vs EUR, CHF, NZD and AUD (but gained vs GBP, JPY and CAD). It seems likely that there are some seasonal factors at play here that may well be unwound in the New Year, particularly after European banks finish repatriating their funds in preparation for next year’s Asset Quality Review. I look for the dollar to resume its upward climb in the new year.
A quiet New Year’s Eve is expected today since the calendar is light once again. We have releases coming out only from the US. The S&P/Case-Shiller home price index is expected to have risen 13.45% yoy in October, not much of a change from 13.29% yoy in September. The Chicago purchasing manager’s index for December is forecast to fall to 60.5 from 63.0, while the Conference Board consumer confidence index for December is estimated to rise to 76.3 from 70.4. All told however I would expect to see position-squaring dominate the market. After a few down days, we could see some dollar buying Tuesday.
On New Year’s Day the only indicator expected out will be China’s manufacturing PMI for December. The figure is forecast to slightly fall to 51.2 from 51.4.
The Market
EUR/USD 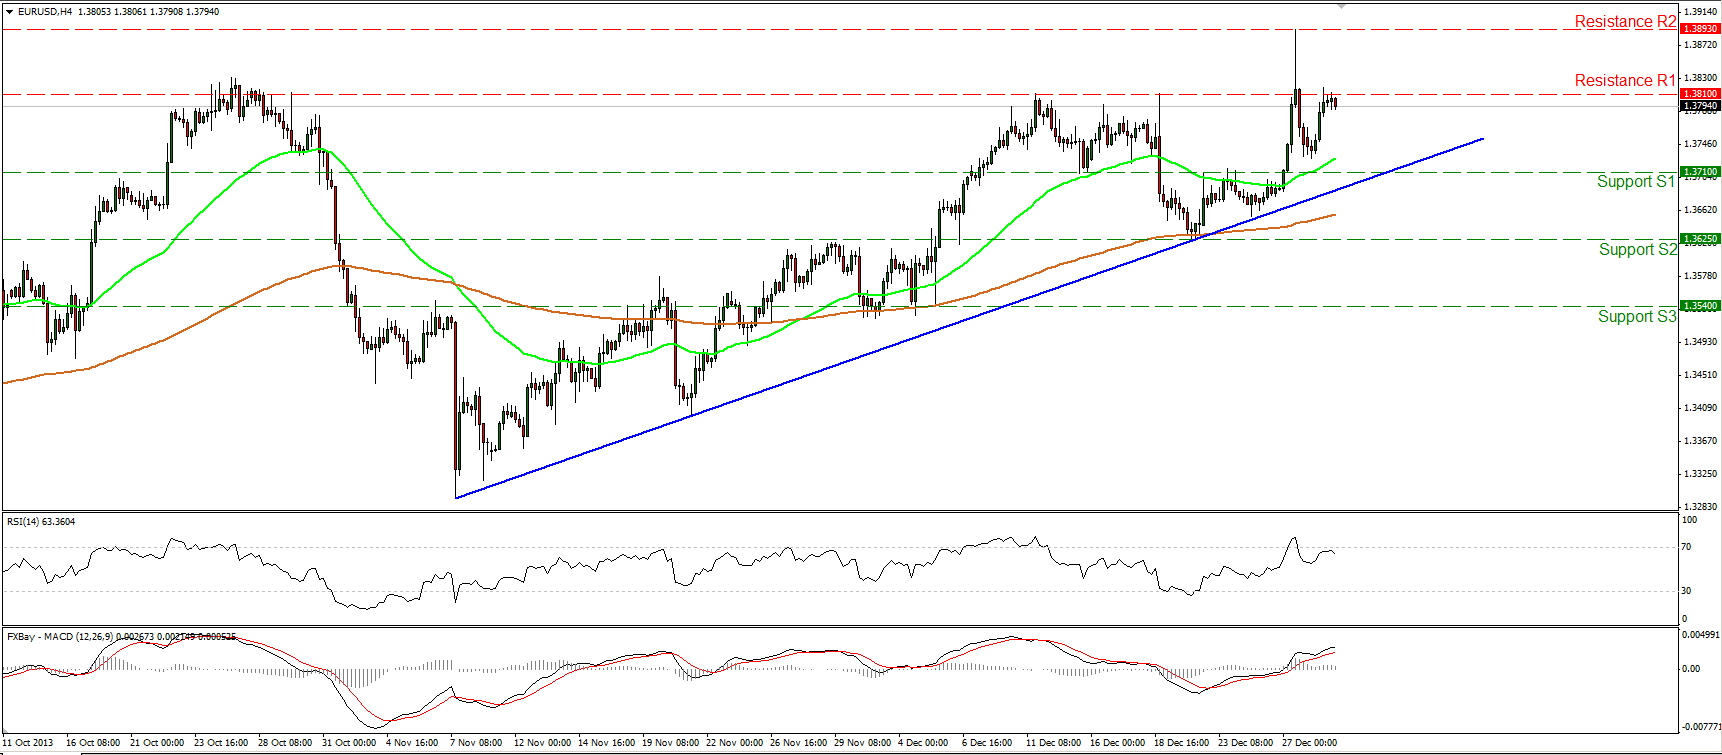 EUR/USD Hourly Chart" title="EUR/USD Hourly Chart" width="undefined" height="undefined">
The EUR/USD moved higher on Monday, but the upward movement was halted by the 1.3810 level. An upward violation may drive the battle once again towards the 1.3893 (R2) barrier. However, since the RSI rebounded near its 70 level and moved lower, I would expect a downward corrective wave during the day. The current uptrend is still in progress and as long as the low of 1.3625 (S2) is intact, I consider the short-term bias to be to the upside.
• Support: 1.3710 (S1), 1.3625 (S2), 1.3540 (S3).
• Resistance: 1.3810 (R1), 1.3893 (R2), 1.4170 (R3).
EUR/JPY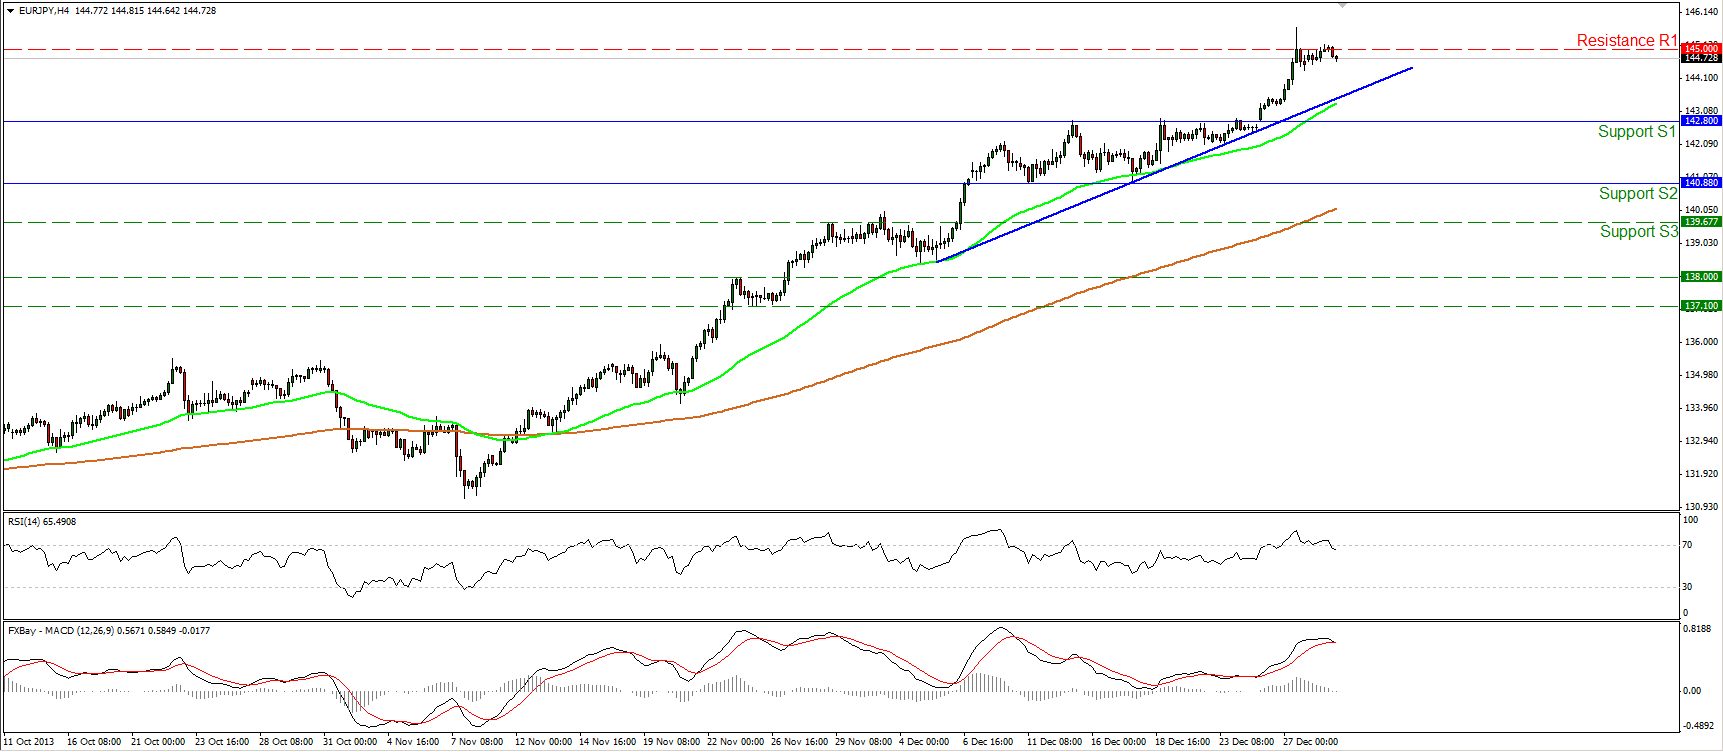 EUR/JPY Hour Chart" title="EUR/JPY Hour Chart" width="undefined" height="undefined">
The EUR/JPY found resistance at the psychological level of 145.00 (R1) and moved slightly lower. A clear break of that hurdle may signal the continuation of the advance towards the 147.00 (R2) area. The RSI exited its overbought zone, while the MACD, although still in a bullish territory, seems ready to cross below its trigger line and as a result we may experience a downward corrective wave before the uptrend resumes. The 50-period moving average remains above the 200-period moving providing reliable support to the price action.
• Support: 142.80 (S1), 140.88 (S2), 139.67 (S3).
• Resistance: 145.00 (R1), 147.00 (R2), 150.00 (R3).
GBP/USD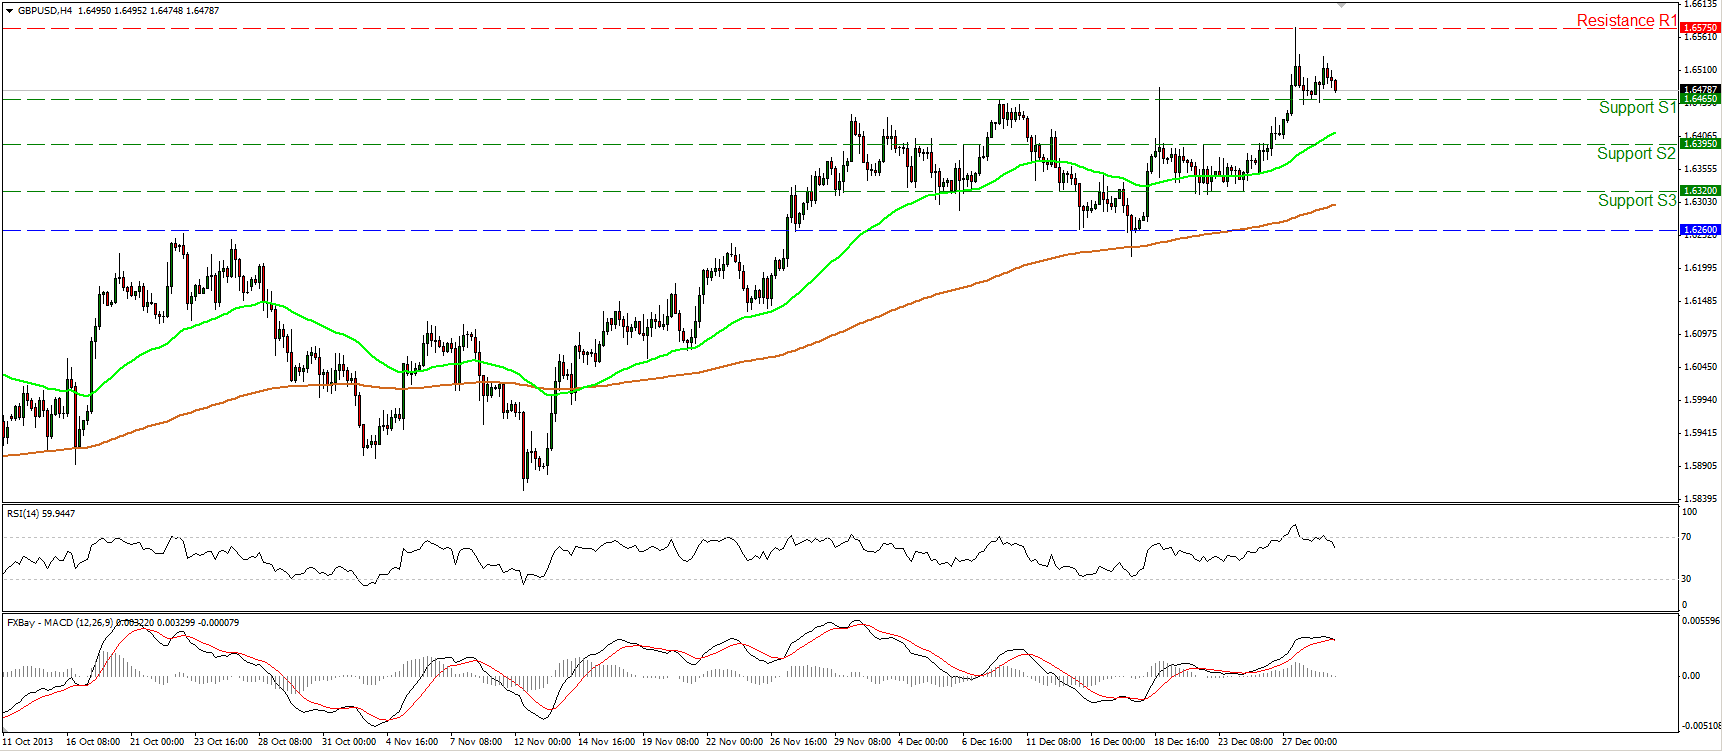 GBP/USD Hourly Chart" title="GBP/USD Hourly Chart" width="undefined" height="undefined">
The GBP/USD remained above the 1.6465 (S1) support barrier. Since the RSI exited its overbought area and the MACD poked its nose below its trigger line, I would expect the price to overcome that hurdle and target the next support at 1.6395 (S2). Nonetheless, as long as the low of 1.6320 (S3) holds, I would consider any downward movement as a renewed buying opportunity. The rate is trading above both moving averages, thus the short-term picture remains positive for now.
• Support: 1.6465 (S1), 1.6395 (S2), 1.6320 (S3).
• Resistance: 1.6575 (R1), 1.6735 (R2), 1.6885 (R3).
Gold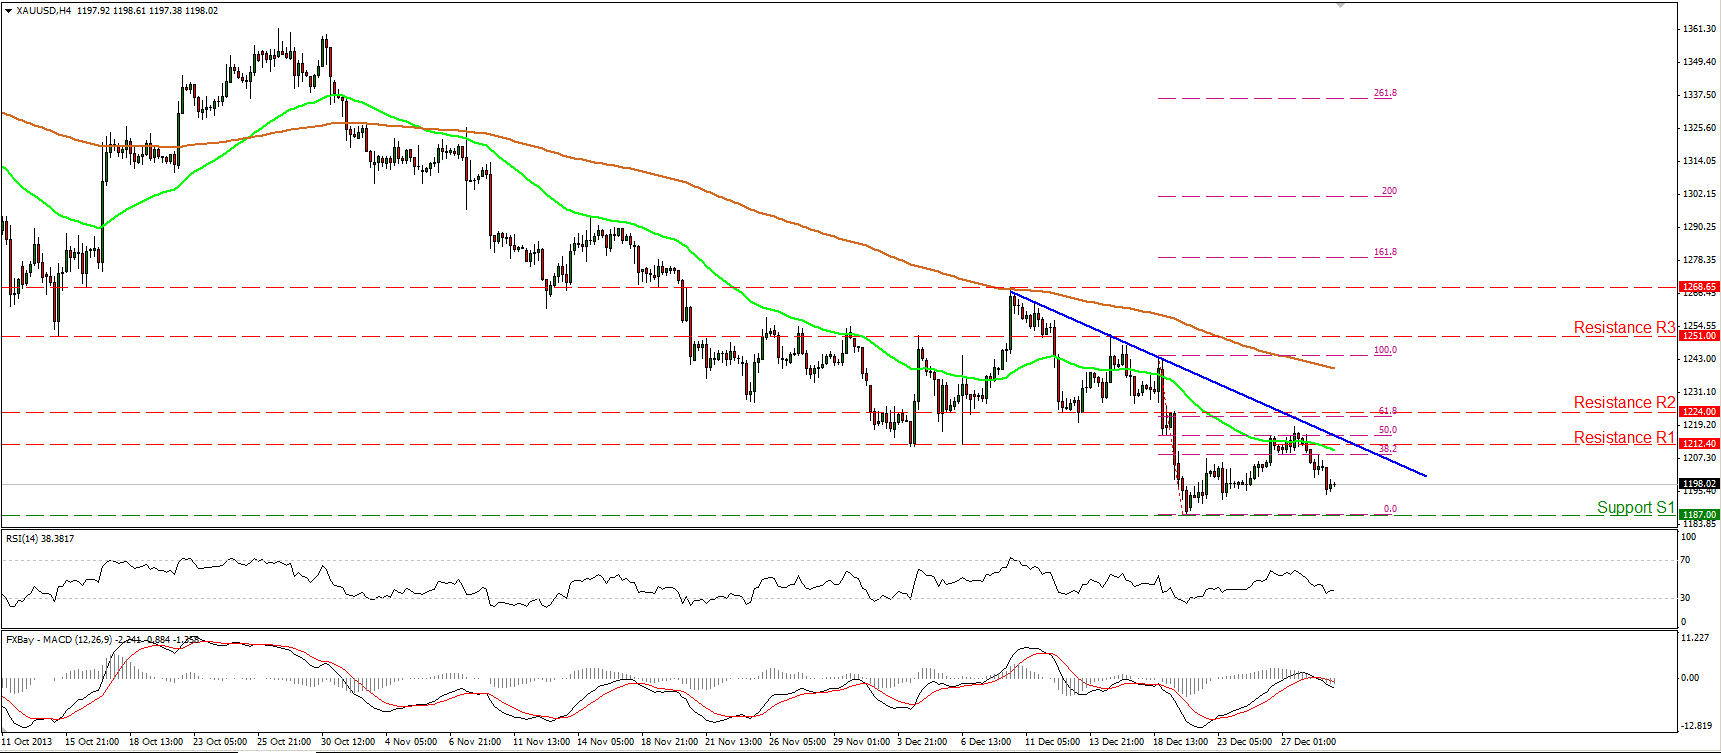 XAU/USD Hourly Chart" title="XAU/USD Hourly Chart" width="undefined" height="undefined">
Gold moved lower after finding resistance at the 50% retracement level of the prior downward wave. A break below the 1187 support level is needed to signal the continuation of the downward path. The MACD crossed below both its trigger and zero lines. The precious metal remains below the blue trend line and below both the moving averages, thus I consider the downtrend to be valid at the moment. Only a violation of the trend line and the resistance at 1224 (R2) would be a reason to reconsider our analysis.
• Support: 1187 (S1), 1180 (S2), 1155 (S3).
• Resistance: 1212 (R1), 1224 (R2), 1251 (R3).
Oil
WTI moved lower, breaking the lower boundary of the downward sloping channel. The bulls didn’t manage to maintain the price above 100.00. WTI is now trading slightly above its 50-period moving average and the 98.90 (S1) support barrier. A dip below that zone may target the next support at 97.25 (S2) which coincides with the 38.2% Fibonacci retracement level of the 92.00-100.60 advance. On the other hand, a rebound at 98.90 may drive the battle higher and resume the short-term uptrend.
• Support: 98.90 (S1), 97.25 (S2), 95.35 (S3).
• Resistance: 100.60 (R1), 101.90 (R2), 103.15 (R3).
Disclaimer: This information is not considered as investment advice or investment recommendation but instead a marketing communication. This material has not been prepared in accordance with legal requirements designed to promote the independence of investment research, and that it is not subject to any prohibition on dealing ahead of the dissemination of investment research. IronFX may act as principal (i.e. the counterparty) when executing clients’ orders. This material is just the personal opinion of the author(s) and client’s investment objective and risks tolerance have not been considered.
IronFX is not responsible for any loss arising from any information herein contained. Past performance does not guarantee or predict any future performance. Redistribution of this material is strictly prohibited. Risk Warning: Forex and CFDs are leveraged products and involves a high level of risk. It is possible to lose all your capital. These products may not be suitable for everyone and you should ensure that you understand the risks involved. Seek independent advice if necessary. IronFx Financial Services Limited is authorised and regulated by CySEC (Licence no. 125/10). IronFX UK Limited is authorised and regulated by FCA (Registration no. 585561). IronFX (Australia) Pty Ltd is authorized and regulated by ASIC (AFSL no. 417482)