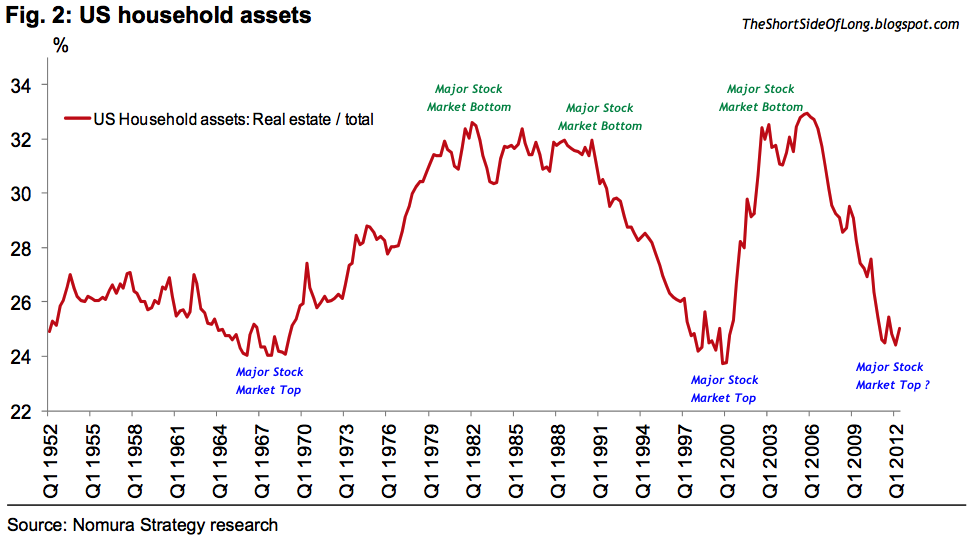
Wall Street analysts are quick to make an assumption that the U.S. housing market is in recovery mode, which essentially will be good for economic growth, employment and therefore the stock market too. While I agree that the U.S. housing market definitely offers fundamental value for long term investors, the story isn't that simple. Real estate prices do not necessarily correlate positively with stock prices, so if we were to assume that Wall Street analysts are right and money does flow into the beaten down housing market, the question we should be asking ourselves is where will this money be coming from? The chart above, via Nomura research, shows the U.S. household asset ratio between real estate and all other assets, with overwhelming majority of the "other" being equities. We can see that households are currently underexposed to real estate and therefore an assumption could be made that this asset will experience favourable attention in the future, relative to others. But, what does that mean for the stock market? Well, last time we saw a similar occurrence, stocks struggled. During 1966 to 1968 as well as during 1998 to 2000, the U.S. equity market peaked out and entered a decade long sideways secular bear market range. Will this time be different? While I do not think U.S. equities will move sideways for another decade, I definitely think we are approaching a major top and a bear market is just around the corner.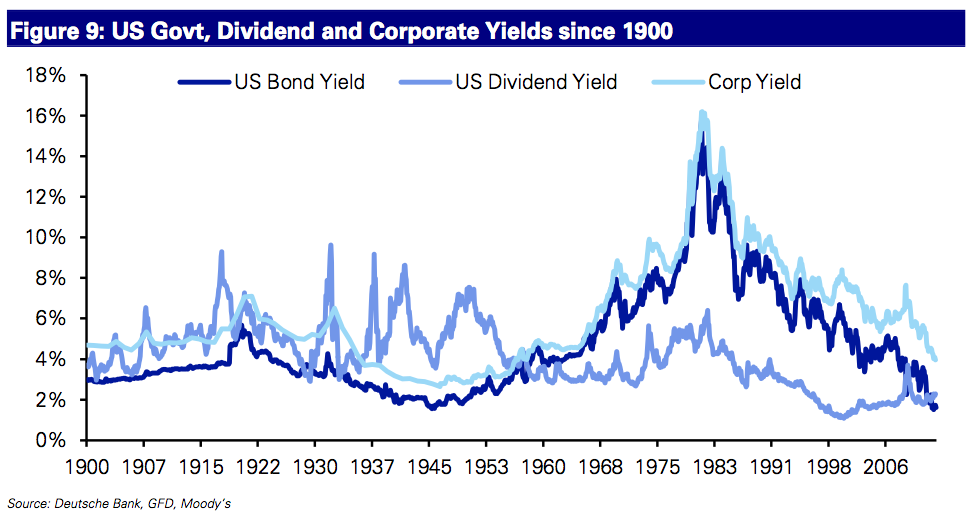
A lot of investors claim that the U.S. stock market dividend yield has now overtaken the Treasury yield, which should result in improved competitiveness for the stock market, in hopes of attracting more money to push it towards higher levels. While I do not want to get into the overall stock vs bond debate, I am not so sure about this theory. I do admit that government bonds aren't attractive at the current yield at all, especially after a prolonged 30 year Kondratiev bull market. However, just because stocks have a higher dividend yield relative to government bonds for the first time since the 1950s, it does not give us an automatic buy signal. As a matter of fact, dating back to the late 1800s, stocks almost always yielded more than government securities until the 1950s secular change. The truth is, while bond yields are very unattractive, the dividend yield on the stock market is also at historically low levels too. I am not sure if we will see a period of high dividend yields in the U.S. equity space again (toward 5% or higher), but what is needed is one of three outcomes: companies increasing their dividends meaningfully, stock prices falling dramatically or a mixture of both.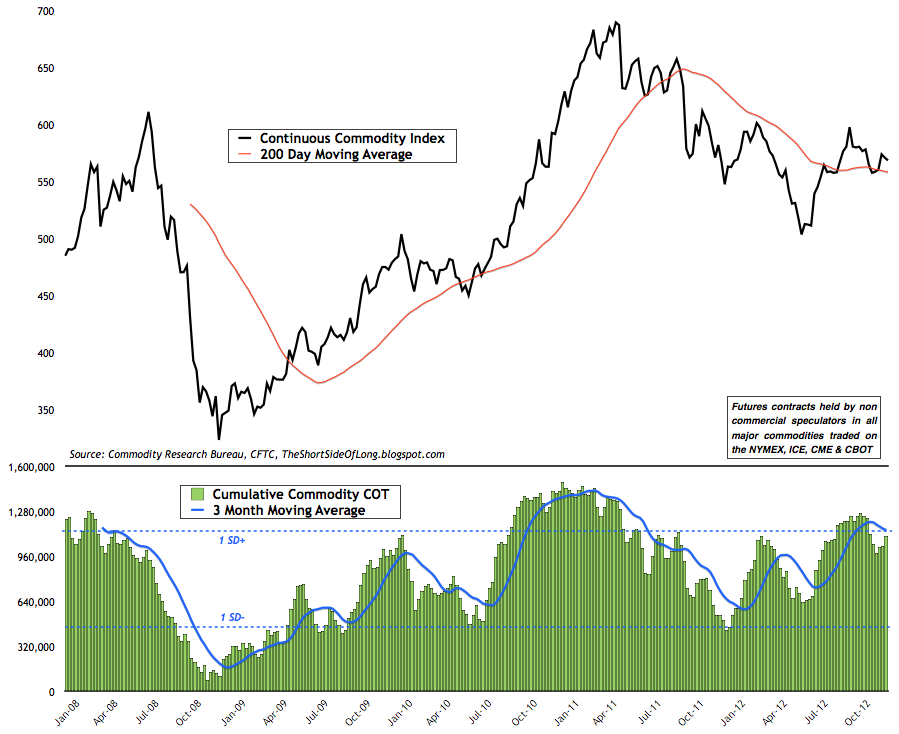
Global hedge funds, influenced by central bank monetary policy, continue to hold above average bullish bets on the overall commodity space. High exposure to any asset, just like the commodities in this example, usually signals that further upside tends to be limited the majority of the time (but not always). This is because the majority of buyers are already participating and stale longs are forced to sit patiently waiting for prices to rise -- and if prices do not rise, a major shake out of weak hands occurs. The majority of technical analysts continue to see a head and shoulders bottom in the CC Index, with a break out above the 600 level signalling a new uptrend, the problem with this view, as we can see through the commitment of traders report, is that the majority of market participants (like hedge funds & other speculators) are expecting the same outcome. So caution should be applied. When we dissect the commodity exposure data into different sectors, we can see that despite a strong correction in price, hedge funds still hold a relatively decent exposure to Agriculture. Furthermore, while not overly bullish, hedge funds still hold modest bullish bets on energy and industrial metals too. Precious metals exposure is definitely more optimistic as well, relative to the summer doldrums experienced this year. While commodity bulls amongst us would prefer hedge funds to be under-exposed and in disbelief right now, which could potentially push prices to higher levels, sentiment isn't extremely optimistic either. There is no clear contrarian edge right now, as we wait for further Fed policy this week.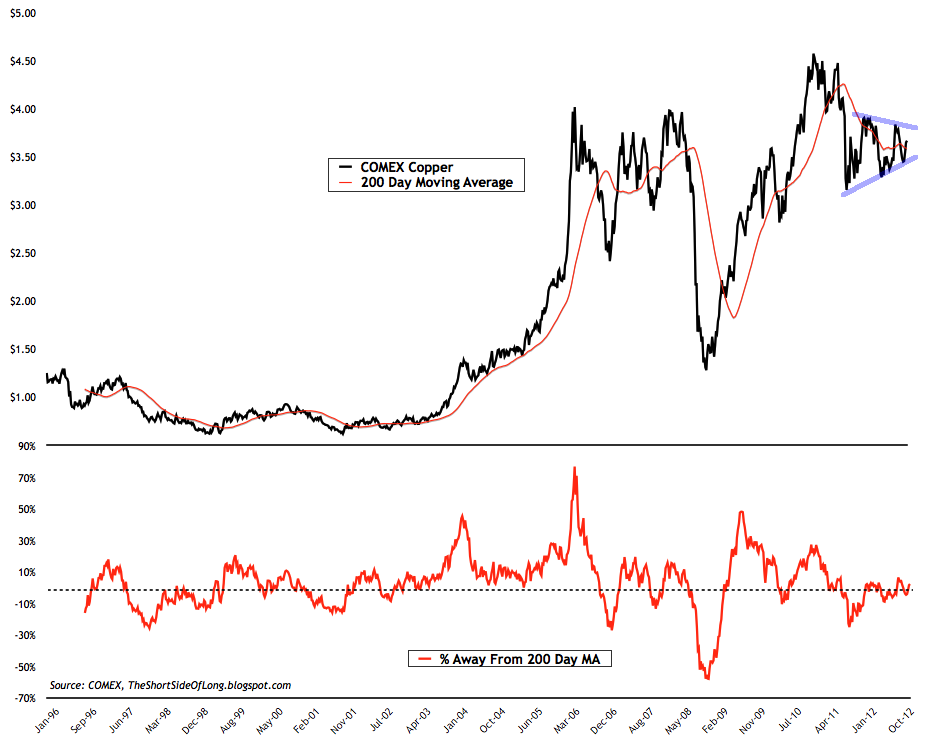
- The fight between bulls and bears continues, without a clear winner just yet. Bulls claim the global economy is recovering and finally EU stocks are starting to outperform, while Chinese manufacturing is expanding once again. They say that this is a very good sign. Bears claim that the recovery calls are premature and finally bull market leaders like Apple are breaking down, as earnings are set to disappoint in the not so distant future. One camp is calling for an inflationary growth outcome into 2013, while the other camp is calling for a deflationary recession as early as 2013. So who is right? Who better to ask than the doctor and Phd holder in economics - Dr Copper. It seems that the price has not decided just yet, as we remain in one of the closest and narrowest price ranges since at least 2004. With the majority of Copper demand coming out of Asia, a break out in price could signal a Chinese recovery. On the other hand, a breakdown in price will definitely signal a bulls worst nightmare - a hard landing in Chinese real estate. Keep an eye on the price very closely... as Copper tends to lead global growth.
My last post covered the QE4 rumours in circulation, so today I thought I'd gauge the sentiment and positioning of market participants within the currency market before Ben Bernanke and the league of extraordinary central banking gentlemen take stage for one last FOMC meeting for 2012.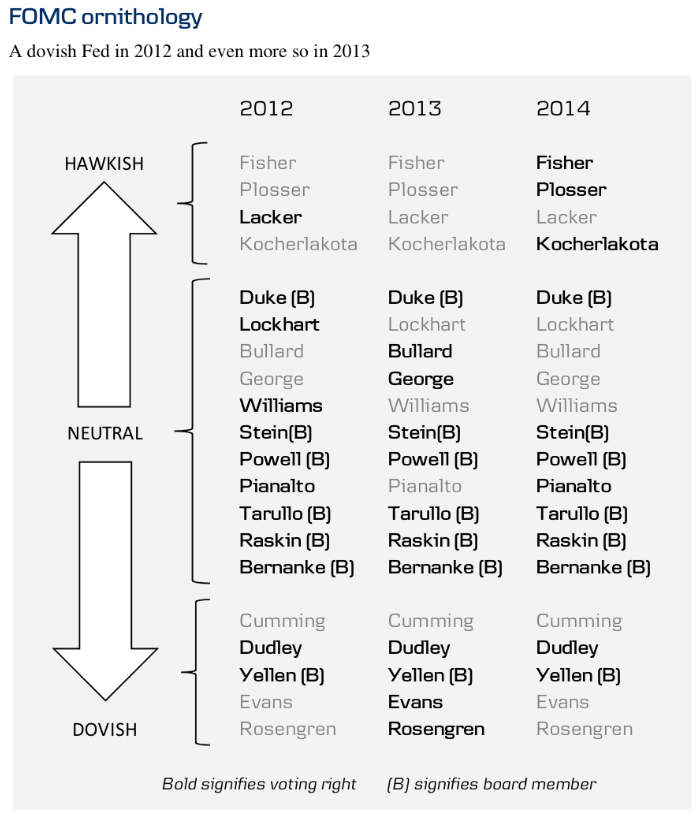
Let me just say straight up that this meeting is not as important as some have made it out to be. In all honesty, regardless of whether the Fed starts further easing this week or sometime in early 2013 is absolutely irrelevant to the markets, as they tend to be a discount mechanism. From what we know, the FOMC board of voting members looks super-dovish next year, with cheer-leading money printer Charles Evans joining the voting ranks together with his side-kick Eric Rosengren. It shouldn't be too difficult to figure out what the consensus of the Fed's game plan will look like next year, with Mr Evans and Mr Rosengren recently giving us some hints. Teaming these two new money printers together with some permanent super-doves like Ben Bernanke, William Dudley and Janet Yellen, and you are sure to get at least up to QE 6 by next year's end. Whether or not these policies will work in pushing up stock and real estate prices remains to be seen, but one thing is for sure -- it will definitely cause some serious volatility in the currency markets.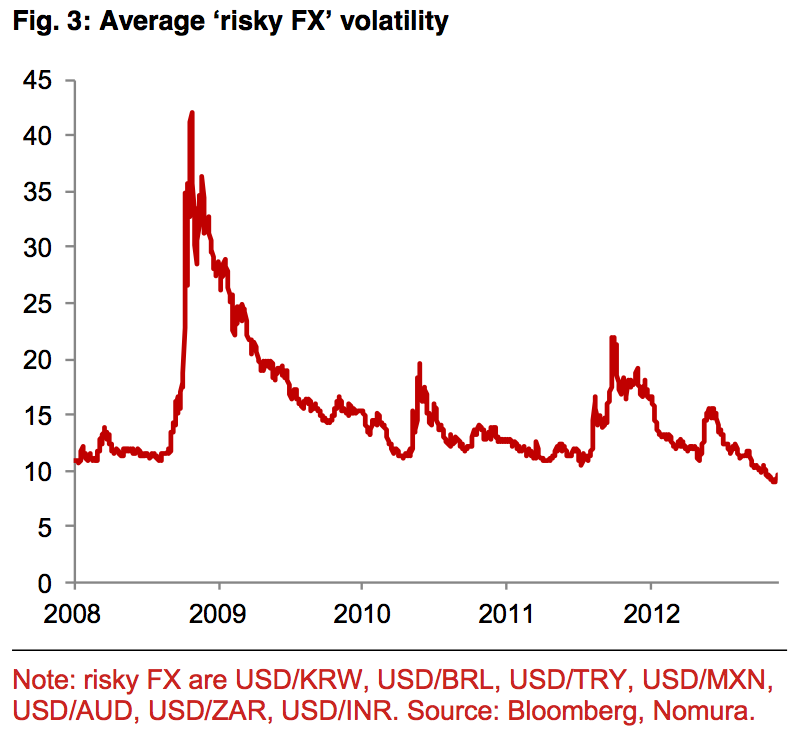
According to the Nomura currency research team, measuring implied volatility on risky currencies such as the Korean Won, Brazilian Real, Turkish Lira, Mexican Peso, Aussie Dollar, South African Rand amongst others is now lower and at more complacent levels than at any other time since at least 2008. Furthermore, currencies like the Mexican Peso and Aussie Dollar hold very high correlation to markets such as the S&P 500, Junk Bonds, Crude Oil, Copper and other "risk on" assets. With volatility so low, let us look at market positioning next.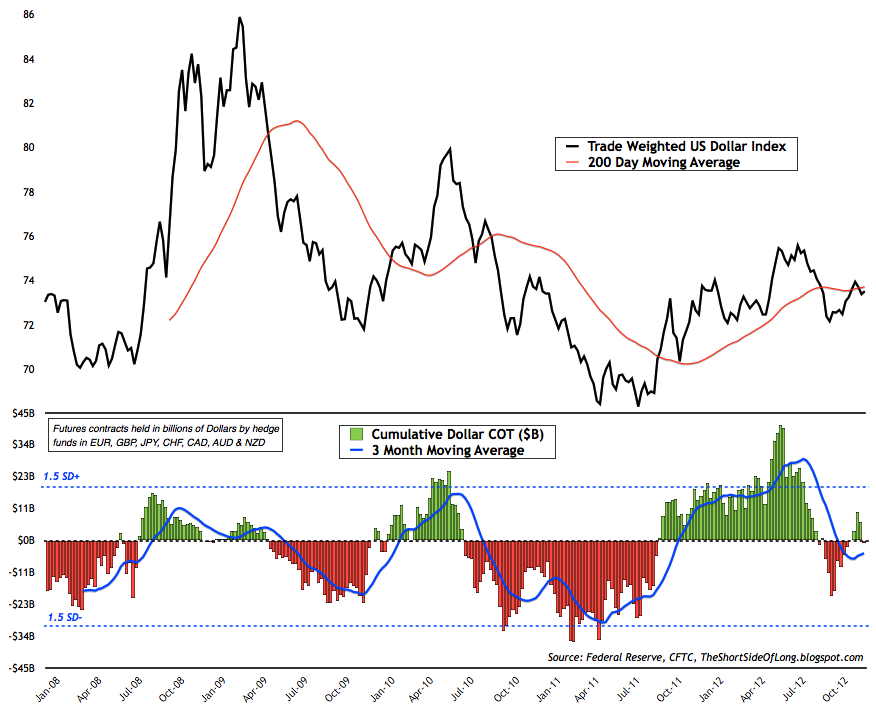
Since the majority of currencies trade first and foremost against the global reserve known as the US Dollar, I always like to start by looking at the overall positioning and sentiment there, before looking at other individual currencies. Looking at the chart above, we can see that market participants were extremely net long the US Dollar around May of this year. You might remember warnings against further Dollar purchases on this blog back around the similar time. What followed was a QE3 sell off and break below the 200 MA for the first time since July of 2011. Now, it seems investors are indecisive on the future trend of the greenback as their positioning is being whipsawed.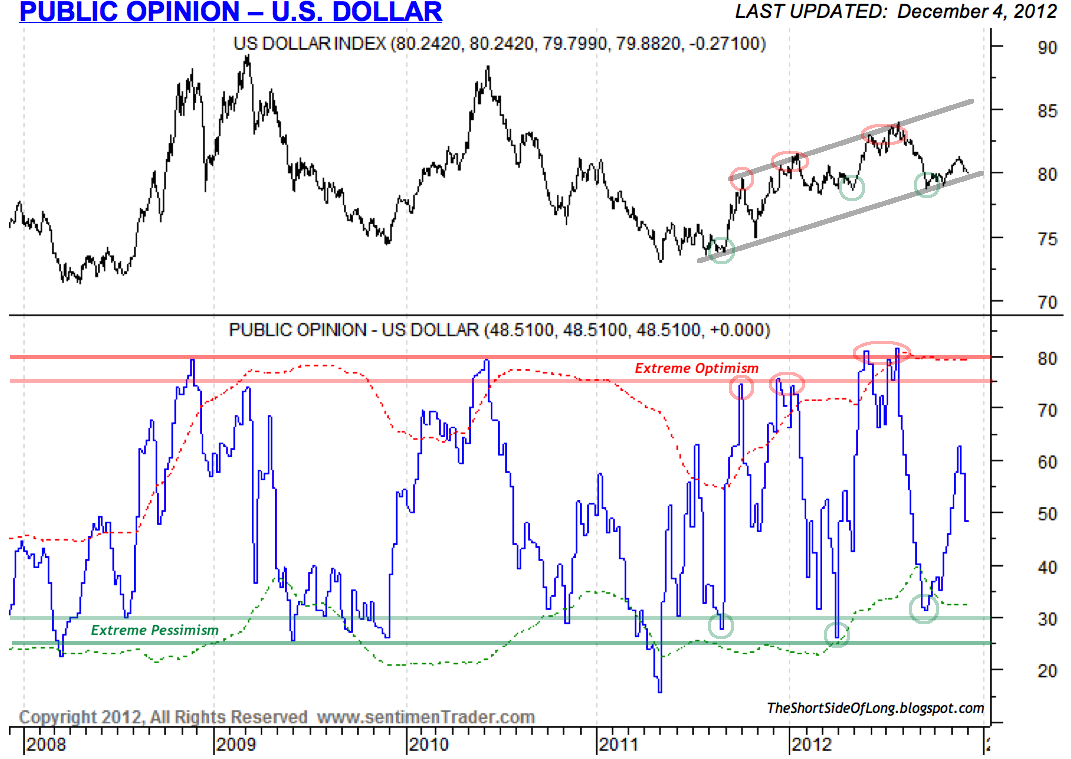
Various sentiment indicators, such as Public Opinion, are also quite neutral too. The Dollar's technical picture has been one of a rising trend channel since the middle of 2011. When the price would retest the resistance of the channel, so would the sentiment and a correction followed. And when the priced would reach the bottom of the channel, so would sentiment and a rally would surprise the majority. Now the Dollar is once again flirting with the support line of the rising channel, but this time around, sentiment is not as bearish as during previous occasions. Can the Dollar rally, despite only neutral sentiment readings, or will we see a break down out of the channel? I'll let Ben Bernanke and the league of extraordinary central banking gentlemen decide that one for me.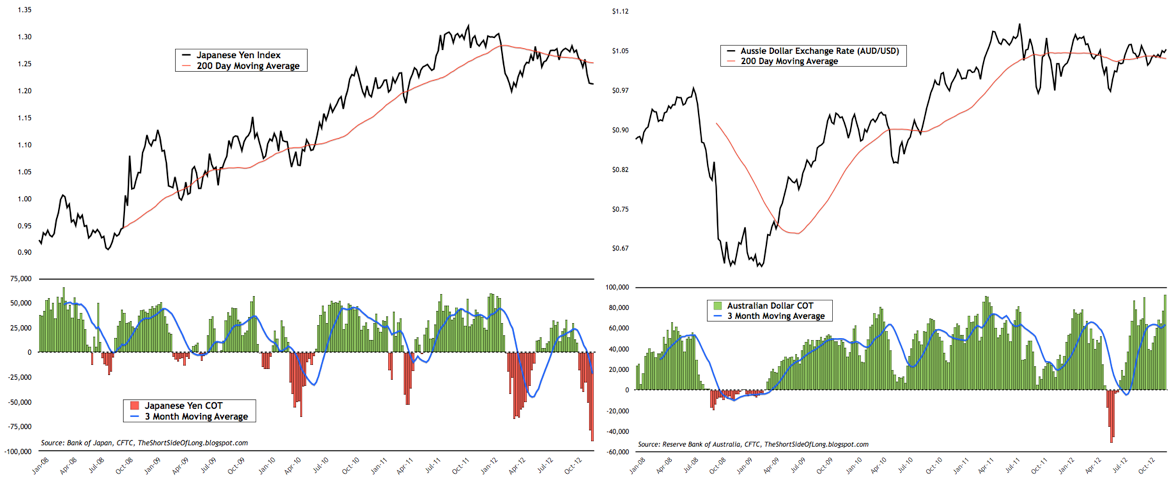
While the Dollar positioning is not giving us much of an edge (just like many other markets), such low volatility has created a lot of complacency in the markets. One of the side-effects of very small daily price movements is usually seen in the over-bullish positioning of carry traders, those investors who usually bid up higher yielding currencies like the Aussie Dollar while shorting the zero yielders like Japanese Yen. The chart above shows that this week's commitment of traders reported an all time record high bullish bet on the Aussie Dollar, while the positioning in the Japanese Yen is third lowest in its history (with small speculators a.k.a. dumb money at record shorts).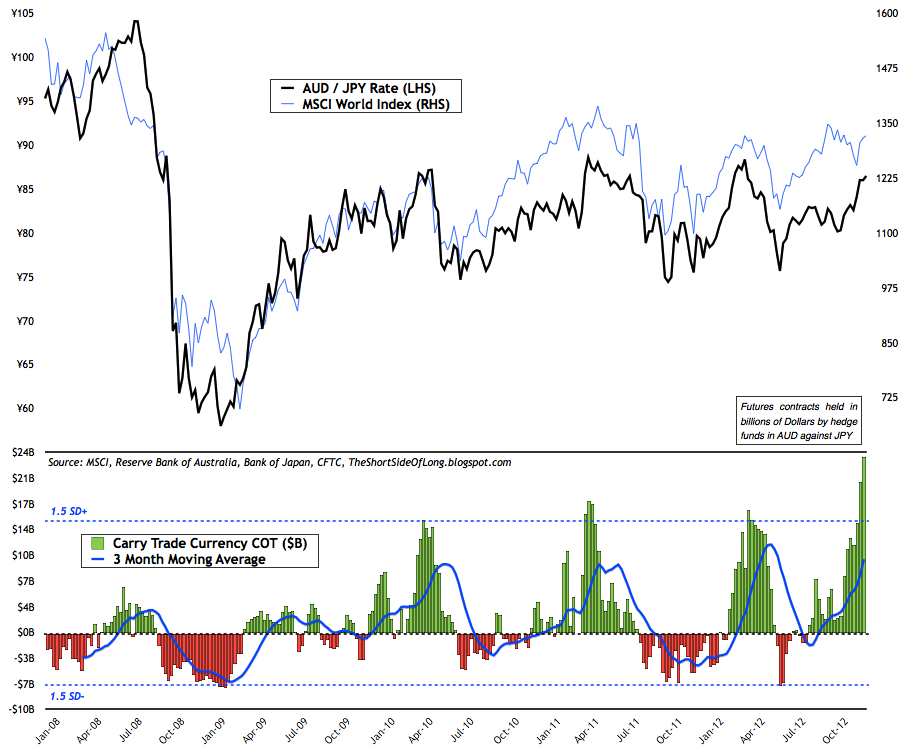
Such extreme positioning between risk on currencies like the Aussie and risk off currencies like the Yen, demands attention and definitely warrants caution. The chart above, which I like to call the Carry Trade indicator, shows that current bullish bets on the Aussie Yen has now reached an overly optimistic 2.5 standard deviations away from the mean and since the exchange cross holds very close correlation to the MSCI World Equity Index, what might follow is a serious correction with similarities to April 2010, May 2011 and March 2012.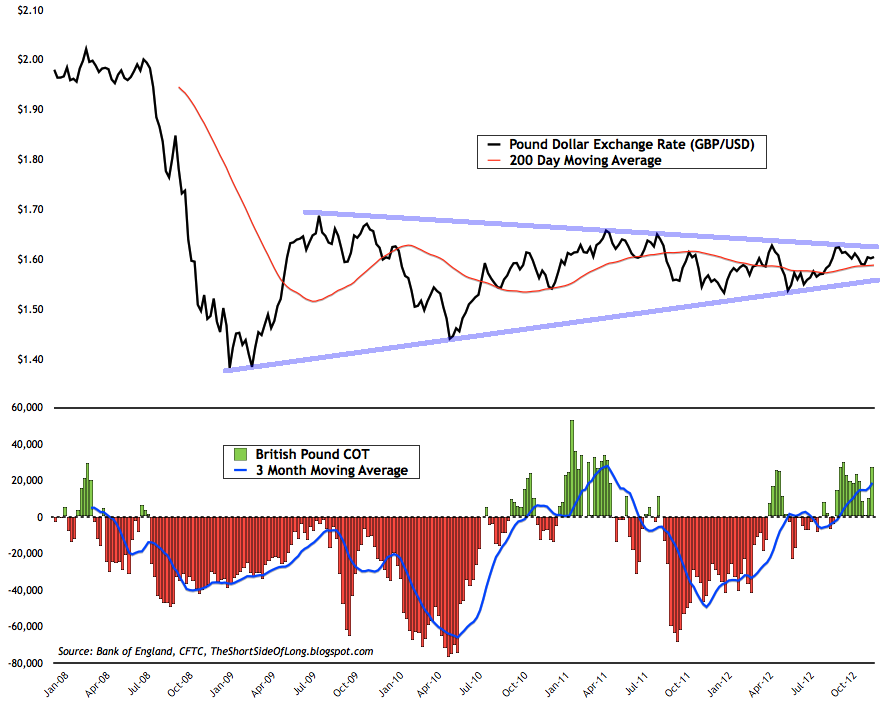
Supporting a case for a major sell off is the relatively large bullish bet on the British Pound, which remains in one of the tightest trading ranges ever seen - a triangular consolation period for over three years. Of course, bulls will claim that the price will break out on the upside, but I am not so sure of that. First of all, hedge funds are positioned for that outcome, so from a contrarian point of view, I'd rather go the other way.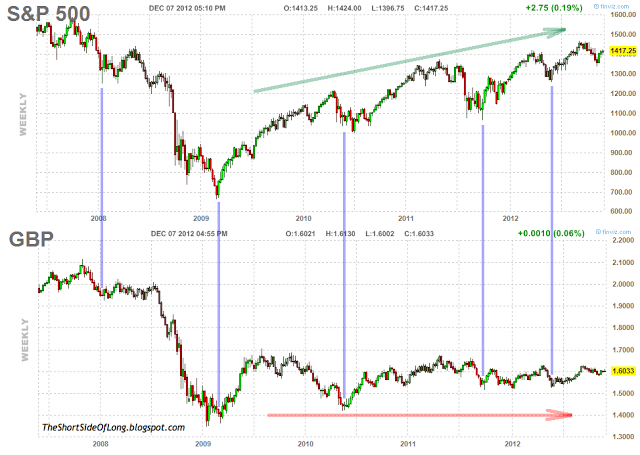
More importantly, the Pound is also highly correlated to the S&P 500, but fundamentally tends to move in its own direction over the longer term. We can see in the chart above that the S&P 500 and the British Pound tend to bottom at just about the same time post corrections. Therefore, one can say that the Pound has had its chance to rally since the March 2009 low and has failed to do so. The last highs were made in 2009 and then again in 2011. Now that the equity markets are overbought and the bull market is aged with the global economy slowing down, I am afraid that Pound bulls might be disappointed. If and when the equity market turns down, with the risk off trade dominating the overall conditions, the Pound will most likely be punished with a move back towards the March 2009 lows.
The currency market seems to be stuck between a rock and a hard place. On one side we have dovish Fed members, who are surely eager and willing to print more US Dollars to post-pone a recession and re-spark some type of economic activity. This tends to be a bearish outcome for the King Dollar and benefits the risk on / inflation trade to some degree. On the other hand, we have extremely complacent volatility with very heavy positioning on either side of the spectrum in both the Aussie and the Yen. Historically, this type of extreme positioning always tends to be mean reverting and could therefore risk asset signal selling directly ahead. The market will decide soon enough
Disclosure: I have recently shorted the Aussie Dollar, and while already being long Japanese Yen, the trade has now turned into a short Aussie Yen exchange rate cross.
Trading Diary (Last update 09th of December 12)
- Economic Outlook: The global economy continues to slow towards a recession, as we find ourselves in the very late cycle of the expansion. United States growth remains below 2% for five out of the last six quarters, with durable goods new orders collapsing recently. The Eurozone remains in a recession, as Germany dangerously flirts with a contraction in growth. German CEOs see the business cycle moving deeper into a downturn with a high probability of recession. Japanese growth rates are once again anaemic post the earthquake recovery, with Industrial Production slowing meaningfully. Chinese growth continues to slow for the seventh quarter in a row, however many do not believe official growth data. Business confidence is decreasing rapidly, while the manufacturing sector has been in a doldrum for a year, confirmed by the slowest electricity consumption since 2009. More importantly the price of cement, iron ore and steel has crashed recently, indicating the end of the property building boom. Finally, exports are now slowing rapidly, while railway cargo freight is looking very weak.
- Equities: Short positions are held in various US equity sectors, which include Dow Transports (IYT), Technology (XLK), Discretionary (XLY) and Industrials (XLI). Large put options have been bought on Apple (AAPL). Call options have been sold on Homebuilders (XHB), JP Morgan (JPM), Amazon (AMZN), IBM (IMB), Commonwealth Bank (CBA), Adidas (ADS) and others.
- Bonds: There isn't a lot of exposure in the bond space, as we believe this sector is experiencing euphoric investor demand. Call options have been sold on Junk Bonds (HYG). Plans to short Long Bond Treasuries (TLT) in due time.
- Currencies: Long positions are held in Japanese Yen (FXY). Short positions are held in Australian Dollar (FXA). The trade is now essentially short Aussie / Yen cross. Put options have been bought on British Pound (FXB) & Canadian Dollar (FXC). Put options have been sold on Japanese Yen (FXY).
- Commodities: Long positions are held in various commodity sectors, which include Silver (SLV, SIVR, PSLV, Comex futures), Agriculture (RJA, JJA) and Sugar (SGG). Plans to increase longs in PMs and Softs in due time.
