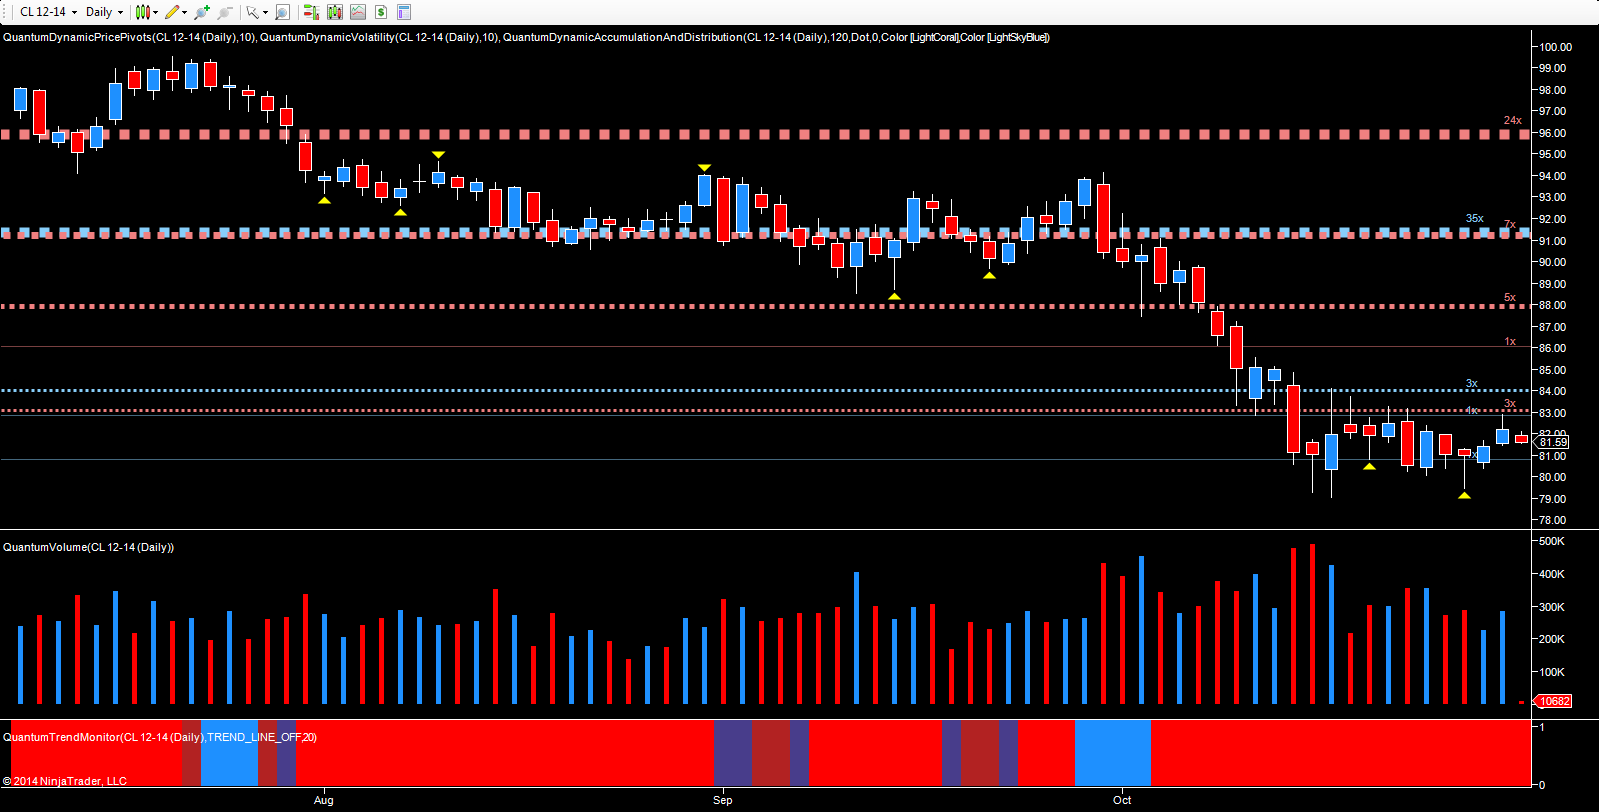
For crude oil traders it’s been a question of keeping an open mind, ignoring the news, and trading what you see on the chart as the commodity continues to move in a congested range, testing the $79 per barrel region below, and the $83.50 per barrel region above where it has remained since mid-October. Even yesterday’s hawkish statement from the FED which sent the US dollar soaring failed to have any significant impact on oil prices.
Whilst gold fell dramatically, oil closed higher with a narrow spread up candle and small wick to the upper body, having touched an intraday high of $82.88 per barrel before closing the session at $82.20 per barrel. Yesterday’s oil inventories also failed to provide much in the way of longer term direction, as the data revealed another build of 2.1m bbls, well below the forecast of 3.3m bbls and dramatically lower than last week’s huge build in supply at 7.1m bbls. Even this ‘good news’ story failed to help oil move higher, and in early trading this morning, the commodity is trading marginally lower at $81.71 per barrel, and looking set to continue its journey back and forth between the two price regions outlined above.
Moving to a more detailed analysis of the technical picture, the significant trading days in October occurred on the 14th, 15th and 16th of October, with the heavy selling pressure of the 14th, then absorbed on the 15th as the big operators moved in with stopping volume on the daily chart, before duly attempting to rally the market on the 16th, but failing at the $84 per barrel region as further selling appeared. Since then, we have seen further buying appearing, most recently on the 27th October, as the hammer candle with above average volume signaled further support, with the market then rallying both on Tuesday and yesterday, before hitting the resistance level denoted with the red dotted line in the $83 per barrel region. This candle also delivered the pivot low signal, validating this bullish sentiment further. However, yesterday’s price action and volume look weak, and suggests a further test to the downside in due course.
For longer term trend traders of oil, once again it is patience that will be rewarded, and with the support and resistance regions now clearly defined on the daily chart, it is a question of waiting for the inevitable breakout from this narrow range. Any move through the floor at $79 per barrel will then open the way for a deeper move lower, whilst a clean break above $84 per barrel, will then put in place a solid platform and springboard for a move higher. For intraday traders, it’s trade what you see not what you hear, and with OPEC remaining relaxed about the current decline in prices, volume as always will confirm the true picture in due course.
