Get 40% Off
🔥 This hedge fund gained 26.16% in the last month. Get their top stocks with our free stock ideas tool.See stock ideas

Chart Of The Day: Warning Sign For Commodities?

Published 03/16/2017, 01:33 AM
Updated 07/09/2023, 06:31 AM

Every now and then you come across a chart that goes against your bias or your previous assumptions. And oftentimes these charts are particularly worth paying attention to.

I previously presented a bullish case for commodities, and continue to hold a bullish bias for a couple of reasons, but I wanted to share the chart that is making me doubt that view.

Despite my preconceived ideas, I felt the chart was so important that it made it into the more fundamental focused Weekly Macro Themes report that I do. See chart below.

A Warning Sign For Commodities?
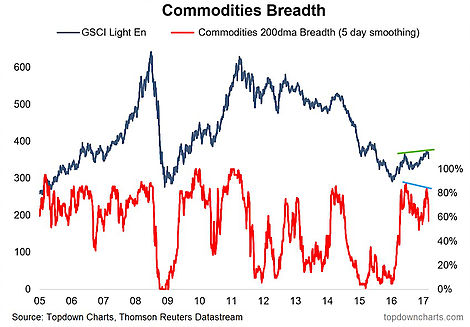
Commodities Breadth 2005-2017

What it shows is the broad commodities index (S&P GSCI Light Energy Index – often the key benchmark for commodities as an asset class), against its 200 day moving average breadth.

The key signal is the bearish divergence: higher highs on price and lower highs on breadth.

Divergences, particularly breadth divergences, can produce powerful signals – often times flagging a major turning point. For example I used this chart along with its companion 50-day moving average breadth chart to pick the bottom in commodities in 2016, based largely on bullish breadth divergence.

To be fair, most of the time when you get a technical signal like this you want to look for a fundamental catalyst. As I noted in the Weekly Macro Themes, this could come in the form of a policy mistake in either China or America – both plausible at this stage of the cycle.

So the risk is, indeed “the warning sign”, that this bearish breadth divergence is flagging a potential renewed bear market in commodities. That will create its own risks and opportunities, but due to the impact of commodities on the overall global macro environment if it were to happen it would have wider reaching implications.

3rd party Ad. Not an offer or recommendation by Investing.com. See disclosure here or remove ads .

Latest comments

Risk Disclosure: Trading in financial instruments and/or cryptocurrencies involves high risks including the risk of losing some, or all, of your investment amount, and may not be suitable for all investors. Prices of cryptocurrencies are extremely volatile and may be affected by external factors such as financial, regulatory or political events. Trading on margin increases the financial risks.
Before deciding to trade in financial instrument or cryptocurrencies you should be fully informed of the risks and costs associated with trading the financial markets, carefully consider your investment objectives, level of experience, and risk appetite, and seek professional advice where needed.
Fusion Media would like to remind you that the data contained in this website is not necessarily real-time nor accurate. The data and prices on the website are not necessarily provided by any market or exchange, but may be provided by market makers, and so prices may not be accurate and may differ from the actual price at any given market, meaning prices are indicative and not appropriate for trading purposes. Fusion Media and any provider of the data contained in this website will not accept liability for any loss or damage as a result of your trading, or your reliance on the information contained within this website.
It is prohibited to use, store, reproduce, display, modify, transmit or distribute the data contained in this website without the explicit prior written permission of Fusion Media and/or the data provider. All intellectual property rights are reserved by the providers and/or the exchange providing the data contained in this website.
Fusion Media may be compensated by the advertisers that appear on the website, based on your interaction with the advertisements or advertisers.
© 2007-2024 - Fusion Media Limited. All Rights Reserved.