Forex News and Events
China’s economy stabilises amid stimulus and weak yuan
According to official data, activity in China’s manufacturing sector expanded more than expected in November, suggesting that an acceleration in the manufacturing industry is finally happening. The official purchasing manager index printed at 51.7 in November, beating the median forecast of 51.0 and was above the previous month’s reading of 51.2. The good news came on the back of a continuous debasement of the yuan, which has fallen another 2% against the greenback over the last five weeks with USD/CHN hitting 6.9650, and easier access to credit. The non-manufacturing gauge accelerated to 54.7 from 54.0 in October. On the other hand, the Caixin manufacturing PMI measure eased to 50.9 from 51.2 in October and below estimates of 51.0, which may suggest that the recovery is not as strong as reflected by the official data. However, the gauge is still above the 50 mark, which separates contraction from extension. All in all, we think that traders should not get carried away by the encouraging official statistics as there are dark clouds on the horizon once Trump ascends to the White House. USD/CNH eased to 6.90 this morning after hitting 6.9654 last week. Even though we expect further stabilisation in the yuan, we do not think it is time to lower our guard as the big picture is actually not that bright.
OPEC agrees on an output cut deal
In eight years OPEC has never managed to reach an agreement on an output deal. Finally, contrary to our expectations, a deal has been struck. There are nonetheless several things to say about this deal which is far from perfect. Firstly, we believe that the real impetus was saving OPEC’s credibility. After eight years of disagreement, an image of mistrust between members could have posed a major risk to the reputation of the intergovernmental organisation.
That said, markets appreciated the deal, and even Russia, a non-OPEC member, also agreed to cut its production by 300’000 barrels a day. A barrel of Brent increased by 10% and closed above $52.
In our report yesterday, we highlighted Iraq and Iran’s growing challenge to Saudi Arabia’s dominance in the cartel. This challenge is now all the more obvious following Tehran’s decision to not cut its output, which it actually raised to 3.8 million barrels a day - not exactly what Saudi Arabia had in mind from its neighbour. This is a significant victory for Iran which has lost market shares due to Western sanctions.
Oil inventories remain very large and we believe that the cut decided at the meeting is likely not to be sufficient to balance demand and supply. The output should be reduced by 1.2 million barrels per day starting in January. We remain nonetheless suspicious on whether the cut will be effective or not.
Unlikely winners are US Shale gas producers, which are now expected to rise in the medium-term
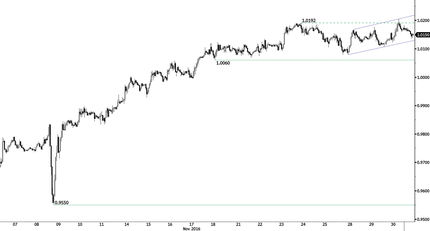
USD/CHF - Short-Term Bullish. 

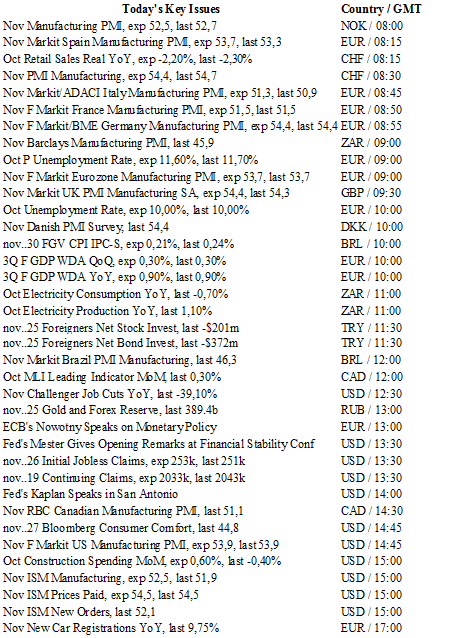
The Risk Today
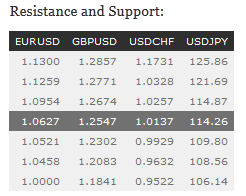
EUR/USD's buying pressures increase. Hourly resistance is given at 1.0686 (29/11/2016 high). Support can be found at 1.0518 (17/11/2016 high). Expected to show renewed bearish pressures. In the longer term, the death cross indicates a further bearish bias despite the pair has increased since last December. Key resistance holds at 1.1714 (24/08/2015 high). Strong support given at 1.0458 (16/03/2015 low) is on target.
GBP/USD is gaining momentum, even though the momentum is not enough yet resistance at 1.2674 (11/11/2016 high). Hourly support is given at 1.2302 (18/11/2016 low). Buying pressures don't seem sufficient. The long-term technical pattern is even more negative since the Brexit vote has paved the way for further decline. Long-term support given at 1.0520 (01/03/85) represents a decent target. Long-term resistance is given at 1.5018 (24/06/2015) and would indicate a long-term reversal in the negative trend. Yet, it is very unlikely at the moment.
USD/JPY's bullish momentum is definitely on. Resistance at 113.90 (25/11/2016 high) has been broken. The pair has bounced back on stronger resistance given at 114.87 (16/02/2016 high). Hourly support is given around 111.36 (28/11/2016 low). Stronger support lies at 108.56 (17/11/2016 low). Expected to see another upside move We favor a long-term bearish bias. Support is now given at 96.57 (10/08/2013 low). A gradual rise towards the major resistance at 135.15 (01/02/2002 high) seems absolutely unlikely. Expected to decline further support at 93.79 (13/06/2013 low).
USD/CHF remains in an uptrend channel. The technical structure bullish. Key support is given at the parity. Hourly resistance at 1.0192 (24/11/2016 high) has been broken. Expected to see further monitoring of the resistance area around 1.0200. In the long-term, the pair is still trading in range since 2011 despite some turmoil when the SNB unpegged the CHF. Key support can be found 0.8986 (30/01/2015 low). The technical structure favours nonetheless a long term bullish bias since the unpeg in January 2015.

