By Pinchas Cohen
Fundamentals and Technicals Support Oil's Return To $40
On May 25, we forecast oil's decline to the low $40s, within 6-8 weeks. We were wrong.
It took only four weeks for the price to reach the June 21, $42.05 low. Since even a broken clock is right twice a day, we decided to return with why we believe that, after the biggest monthly rally of the year, we predict oil is headed back again to the low $40s, if not lower.
Fundamental Background
Since our post of May 25, oil has fallen on ongoing, rising production from Nigeria and Libya, two OPEC members exempt from the production cut agreement, as they try to regain capacity after each of their countries has been ravaged by strife, and US production.
Since the 2014 oil crash when the commodity fell from $107 a barrel, oil companies have become more efficient due to technological advancements, as well as business survival tactics. Therefore, US oil companies continued to produce despite lower prices, as they have learned to become profitable on lower revenues.
If that wasn’t enough, there were reports that oil companies hedged themselves, guaranteeing $50 a barrel, irrespective of the market price, which naturally incentivized them to keep pumping oil in order to bring in profits. Later, reports claimed that US companies would be profitable even when oil's price reached as low as $20, something we haven’t seen since 2002.
So why then did oil return to $50?
Fundamentally, supply interruptions from Canada, Nigeria and Iraq; OPEC’s promise to deepen the cuts in 1.8 million barrels a day; and reports that those infamous hedging contracts are about to expire, making it impossible for them to secure additional such contracts at these new, lower prices.
At the same time, Halliburton) announced it believes that shale drilling peaked a number of days after Baker Hughes published that the number of drilling rigs declined for a second time in four weeks, which nicely coincided with depleting stockpiles.
Technically, after a 19-percent decline, short traders were taking their profits and traders went along, for a cool, 19-percent discount – what the industry generally refers to as a correction.
Winter Is Coming For Oil
As supply disruptions end, producers resume pumping, flooding the market. This includes OPEC members, whose production rose 210,000 barrels a day in June, according to a Bloomberg survey of analysts. At OPEC’s current production level, the market is estimated to have a supply deficit of only about 500,000 barrels a day, for the second half of the year. Accordingly, OPEC will fail to achieve its stated goal of eliminating the global glut this year.
Depleting stockpiles are a seasonal phenomenon, caused by rising demand due to summer driving. But winter is coming.
Investors look toward the weekly data released by the US Energy Information Administration at 10:30 EDT, in which Reuters’ analysts expect a continued drawdown of 2.9 million barrels, after a bigger-than-expected drawdown of 7.2 million barrels in the previous week.
They may be wrong. The American Petroleum Institute yesterday published figures showing US crude actually rose 1.8 million barrels in the week ending July 28 to 48.8 million.
Technically Speaking, The Trend Should Continue
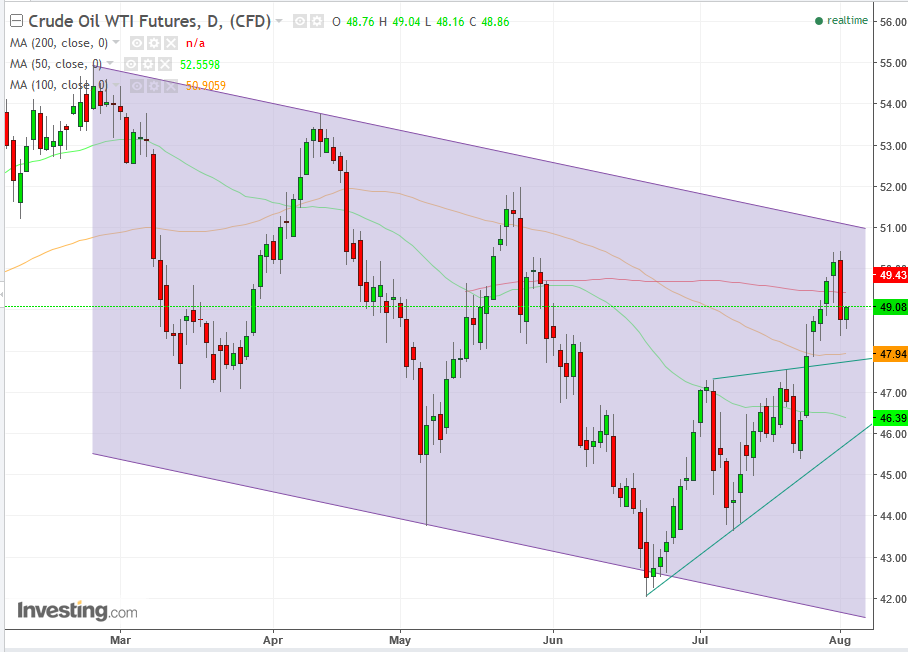
The price has been trading within a falling channel since the $54.94 high on February 23. Yes, this is the same falling channel we referred to in our earlier post. As long as the peaks and troughs of the price resume moving downward, the trend is expected to continue.
Of course, something unexpected may push the price out of the pattern and alter its outlook, but the same can be said about fundamental analysis. Analysis and trading are not about knowing what the future holds but rather are predicated on maximizing probabilities and managing risk.

The MACD – which compares sets of data over varying periods – reached its most overbought level since mid-January, while the RSI – a momentum oscillator that measures the price change and the rate of the change – reached the most overbought condition since June 2016. This reveals that the current upward momentum is sharper than that of the November-December rally which was spurred by the famous OPEC-NOPEC deal.
That makes sense, since the current near-20-percent rally rose out of the bear-market abyss, after the price fell more than the 20-percent reversal gauge, when it dropped 23-percent from $55 in February to $42 in June. The concept of an overbought condition is a suggestion that the market exaggerated and is ripe for a correction, or rather in this case a resumption of its main downward trend.
Additionally, on Monday we forecast that the CAD will weaken, which confirms a weakening oil price.
Trading Strategies
Conservative traders may wait for an ideal short if the price reaches the $51 channel top, or at least $50.43 of yesterday’s high.
Moderate traders may be happy to short on a return-move to the $50 key price or at least the $49.42 resistance of the 200 dma.
Conservative traders may short now, providing they can afford the stop-losses per the above key levels.
Target Prices
- $48.00, top of consolidation, protected by the 100 dma (orange)
- $47.00, corrective uptrend line since June 21, protected by the 50 dma (green)
- $45, round psychological support
- $42.00, support of previous, June 21 trough
- $40, key support level, after a resumption within the falling channel
