Beginning in late 2012, as the Federal Reserve announced their latest innovation of "quantitative easing," the markets launched into an uninterrupted advance that lulled investors into a complacent slumber. Well, that is until a couple of weeks ago when volatility returned with a vengeance and reminded investors that markets can indeed go down.
The markets were, after a near 8% fall, able to garner a bit of a rally from the intraday lows of last week that now has everyone asking whether the current correction is over. For example, Brett Arends recently asked that exact question:
"So how much further might the market fall?
If this is merely a regular correction in the course of a regular economic expansion, the answer may be: Not much further.
Corrections of 5% to 20% are a normal part of the stock market. Legendary Wall Street mogul J.P. Morgan,(NYSE:JPM) +0.77% once asked for a stock-market forecast, confidently predicted that share prices would fluctuate. And he's been right ever since."
However, could the current correction be the start of something bigger?
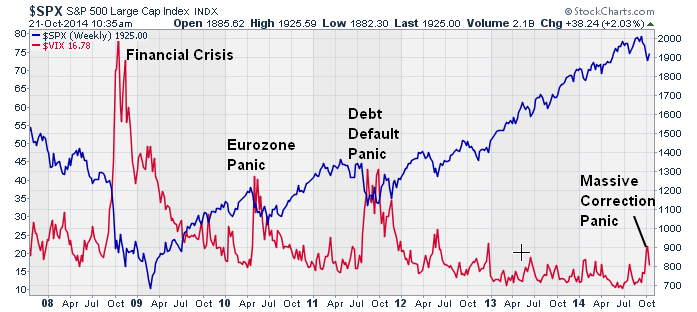
First, let's put the current "massive market correction" into perspective. The chart below shows the S&P 500 overlaid against the Volatility Index VIX. While volatility did spike higher over the last couple of weeks, it is well within the bounds of the excessive complacency that has been the hallmark of the recent bull market surge.
In last week's newsletter I stated:
"The markets did rally to initial resistance but failed to climb above it at this point. However, the markets are oversold enough on a short-term basis that we may see further rally attempts next week particularly if the Federal Reserve holds the line on their current 'tapering' process."
That rally has indeed occurred as expected as "dove-ish" talk from the Federal Reserve, along with an impotent ECB, continues to make "hope" spring eternal for market bulls. Here is the problem. The Federal Reserve will end its current liquidity program next week and the ECB will likely be unable to expend enough "firepower" to pull the Eurozone out of its deflationary spiral.
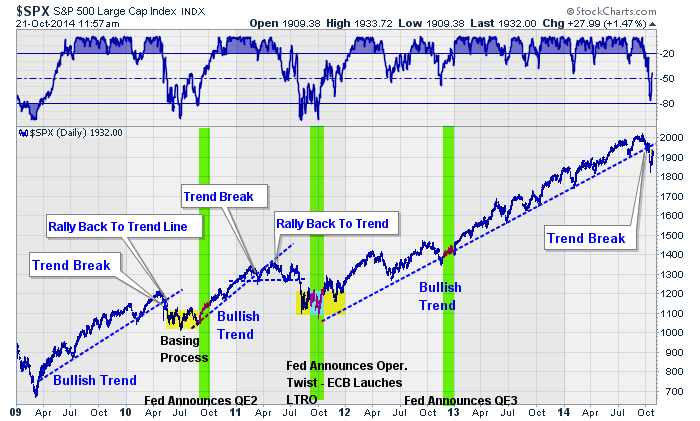
Furthermore, for the first time since 2012, the markets have experienced "real" technical damage which will take some time and effort to repair. As I touched on last week, the S&P 500 has now broken its bullish "uptrend" for the first time in 3 years as shown below.
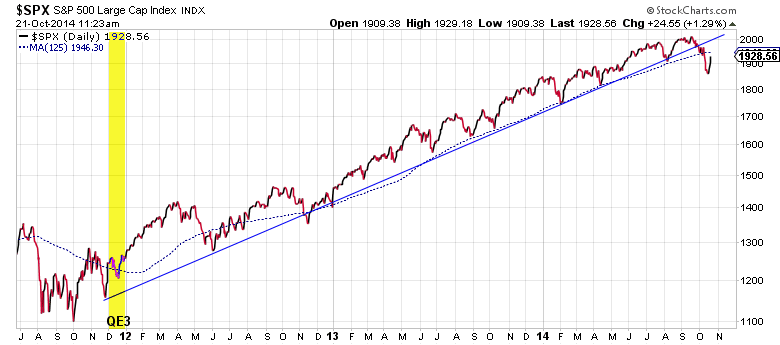
The break of the bullish trend line is important and suggests that a further corrective process is likely. The last two times that the markets behaved in this way was in 2011 and 2012. Let's take a look at what happened to the markets in these two periods to see if we can derive an assumption about what may lay ahead currently.
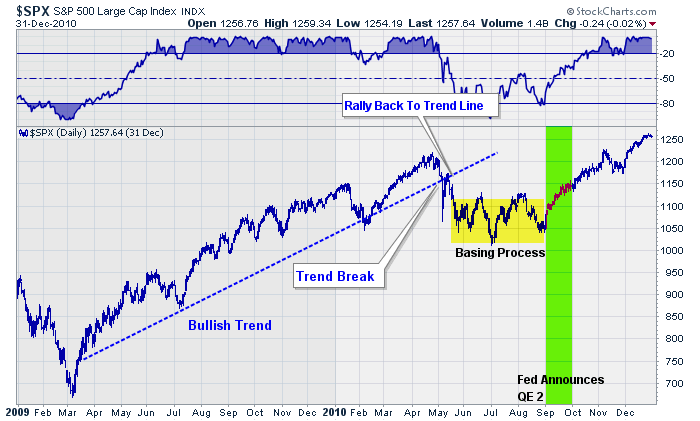
In 2010, the world was just rebounding off of the financial crisis lows as the Federal Reserve's first round of QE had injected over $1.2 Trillion into the financial system. Inventories had rebounded and nascent signs of economic growth had taken hold (remember "green shoots?"). However, as the Federal Reserve brought their liquidity support to an end, economic weakness resurfaced, and markets began to slide.
After an initial sharp break of the bullish trend, markets rebounded sharply to the upside giving "hope" to market bulls that the "selloff" was over. It wasn't.
The ensuing months led to a further decline and a basing process that eventually ended as the Federal Reserve, concerned about the prospects of a recessionary relapse, stepped in with a second round of quantitative easing. It was at this point that Ben Bernanke, then Chairman of the Federal Reserve, made "asset prices" an implicit target of Fed policy.
With the support of the Fed's liquidity flows, asset prices recovered and began to rise once again. But it did not last long.
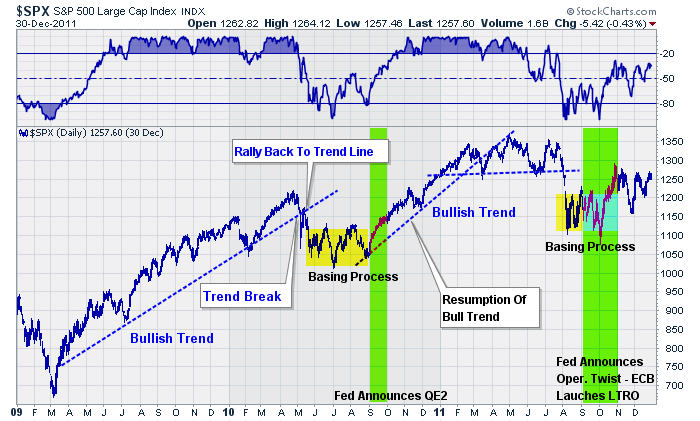
In 2011, the world was saddled with a global deflationary pressure caused by a manufacturing shutdown as Japan was devastated by the tsunami, tidal wave and a near nuclear disaster. The only thing that was missing was Godzilla smashing up Tokyo.
That summer, the Fed's second round of QE had come to an end, and the market once again began to slide breaking through the bullish trend at that time. The resurgence of economic weakness combined with a "debt ceiling debate" and a threat of a "government default" sent stock prices plunging almost 20% in just over three weeks. The markets initial rebound was short-lived, and the market found a "lower low" over the next two months.
The Federal Reserve, again worried about a potential relapse in the economy stepped up with "Operation Twist" that had a more muted impact on liquidity inflows. However, combined with the ECB's "Long Term Refinancing Operations," market participants once again found the liquidity support necessary to start the next leg of the bull market journey. The market was then accelerated when the Federal Reserve "threw gasoline on the fire" with QE3 in late 2012.
Importantly, in both cases, the initial plunge in the market that broke the bullish trend lines led to a basing process that lasted for a period of time before the "bull market" was able to resume. IMPORTANTLY, the initial rebound in the market was NOT A BUYING opportunity, but rather an opportunity to reduce portfolio risk.
With the Fed's liquidity support now ending, the markets have once again plunged below the bullish trendline. The current rally, like every other time, is most likely a short-lived rebound from extremely oversold short-term conditions.
Importantly, the deterioration in the internal dynamics of the market also suggest that the current rebound is not the resumption of the current bull market cycle, but rather a bounce that will likely be used to liquidate holdings. This will likely lead to a retest of lows, or even perhaps the setting of a new low, before a bullish trend can be re-established.
That is, of course, assuming that the current breakdown in the market is just a rest-stop along the path of a continued "bull-market."
With global deflationary pressures picking up steam, high-yield credit starting to signs of instability, and the lack of liquidity support from the Federal Reserve, a case can be made that the current rout is the start of potentially a larger intermediate-term correction.
While this is certainly the case, we will have to wait to see how the markets develop over the next couple of weeks. In the meantime, history suggests that the current bounce is in line with what should be expected within the context of a more protracted corrective process. As I stated recently:
“While I am not stating that the ‘polar icecaps’ are melting and that we are about to experience ‘tidal destruction’; I am suggesting that the potential for further declines in the market are a significant possibility. Therefore, reducing portfolio risk in the short-term will provide capital to reinvest at a more favorable point in the future. If the market surges back to new highs, and re-establishes the previous “bull trend,” then the capital raised can be reinvested with greater confidence of a continued advance.
There is little risk in practicing some form of portfolio ‘risk management.’ The real risk is doing nothing and then spending the next advance in the market making up previous losses. That has been a successful investment strategy ‘nowhere, never.’”

