
Roughly ever six months or so I do a chart analysis of the markets primarily focused around macro indicators of valuation, complacency, and leverage. However, recent market action needs to be addressed with respect to the deterioration of market internals.
Despite the ongoing debate being waged on Wall Street over whether the markets have entered into the next great secular bull market, for investors it is the short-term destruction of capital that is inherently more important. After one of the longest market advances without a correction of at least 10%, investor complacency has risen to extreme levels. Furthermore, the lack of normal corrective actions will magnify the psychological impact on investors by making it "feel" worse than it is. This will ultimately lead to investors making "emotionally" based "sell" decisions that will have a negative impact on long-term returns.
As investors, our job is rather simple - "buy low / sell high". Unfortunately, mainstream media and analysts will never tell you to "sell", which means you rarely have the capital to "buy" with.
So, is this now the time to "sell?" The following series of charts below is designed to allow you to draw your own conclusions. I have only included minimal commentary to clarify points or chart construction.
Subscribe to the free X-Factor Report E-Newsletter for weekly technical analysis and recommendations of major markets, sectors, commodities, interest rates and portfolio allocations. If you have any questions, or comments, you can email me or send me a tweet: @lanceroberts
Major Markets
(In order to reduce the day-to-day "noise" of market movements, all of the charts below are based on weekly closing data.)
Not surprisingly, since the Federal Reserve engaged in the latest round of quantitative easing domestic markets have far outperformed their international counterparts.
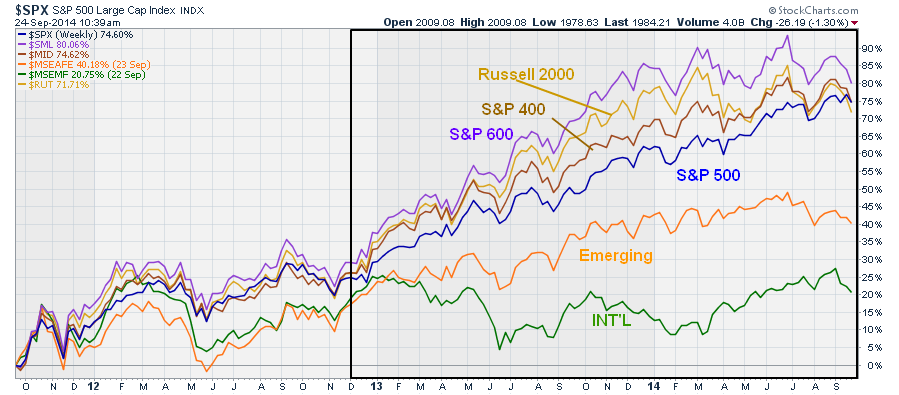
However, since the beginning of the year, as the Federal Reserve has begun to reduce their "liquidity-driven goodness" markets have begun to stagnate at the levels I indentified earlier this year.
"This is something that I discussed previously. The chart below shows the historical correlation between increases in the Fed's balance sheet and the S&P 500. I have also projected the theoretical conclusion of the Fed's program by assuming a continued reduction in purchases of $10 billion at each of the future FOMC meetings."
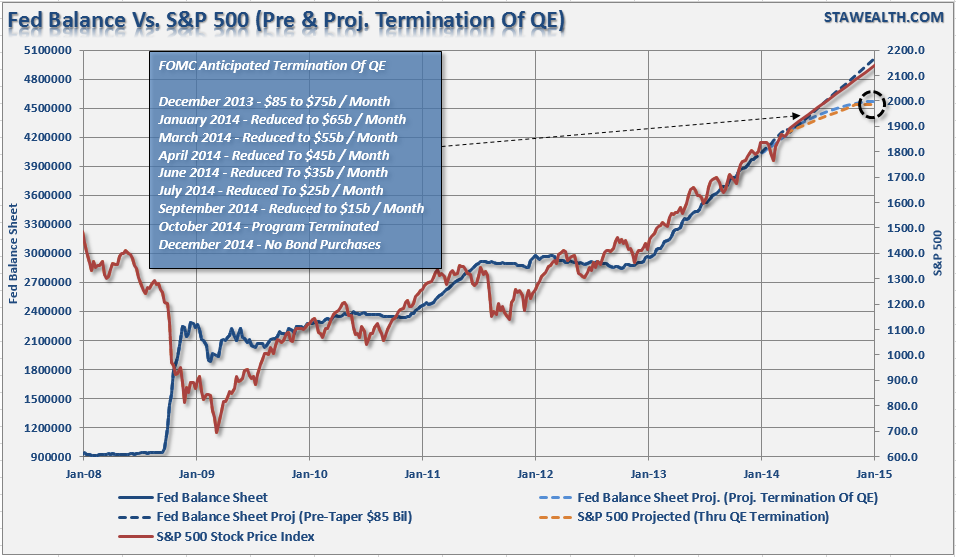
"If the current pace of reductions continues it is reasonable to assume that the Fed will terminate the current QE program by the October meeting. If we assume the current correlation remains intact, it projects an advance of the S&P 500 to roughly 2000 by the end of the year. This would imply an 8% advance for the market for the entirety of 2014."
Interestingly, the large cap Nasdaq and S&P 500 have been less affected by the reduction of "liquidity" as risk trades have rotated towards safety.
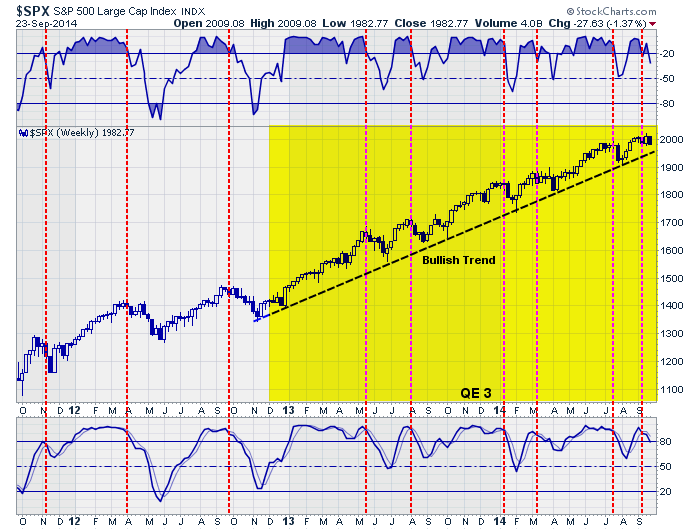
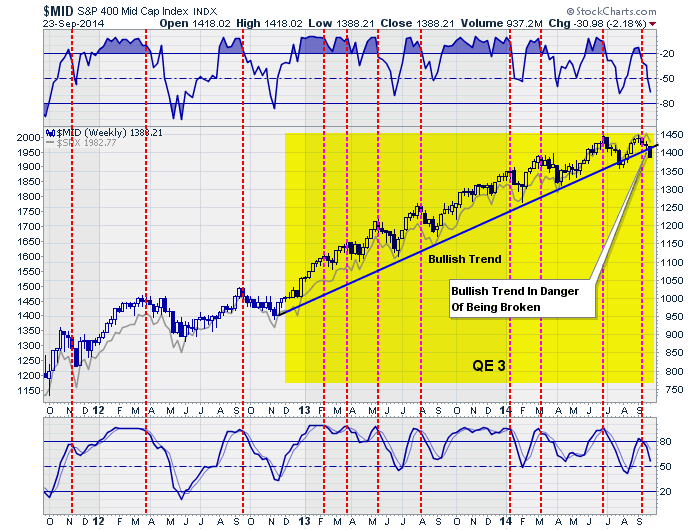
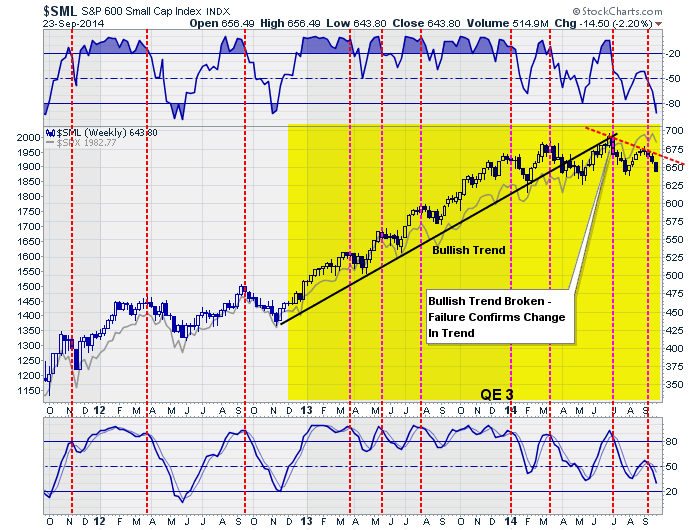
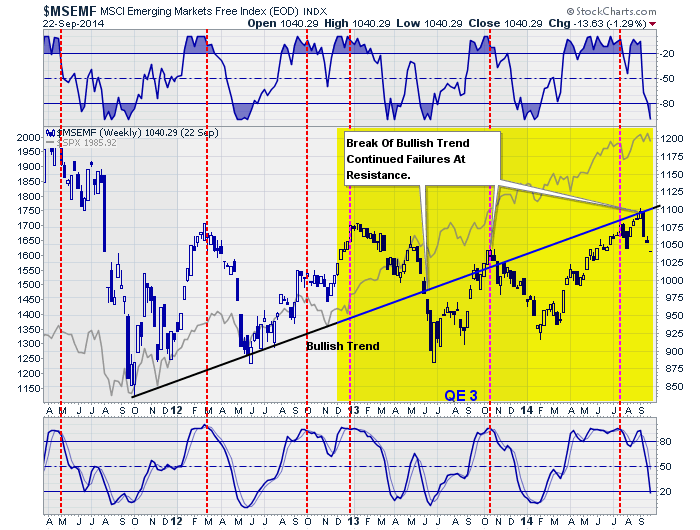
This is shown more clearly in the next five charts which shows the price of large, mid, small, international and emerging market stocks. I have highlighted the current round of the Fed's quantitative easing along with the bullish trend line since the program's beginning. Furthermore, as noted by the vertical dashed lines, I have identified when markets issued "sell" signals within the bullish trend.
[Note: Sell signals, as often misconstrued by mainstream analysis, does NOT mean to sell everything and go to cash. These are simply signals that indicate points where prudent "risk management" should be undertaken, profits harvested and portfolios realigned with models.]
Currently, large capitalization stocks are still holding their bullish trend.
This is not the case for medium capitalization stocks which are currently below their bullish trend. (Since, this is only mid-week, this analysis could be reversed in stocks rally strongly enough by the end of the week to climb back above the trend line.)
Small capitalization stocks have by far fared the worst. Not only have small-cap stocks failed at their bullish trend, they have also reversed from a positive to a negative trend. This is where the greatest "risk taking" has been taking place and as liquidity evaporates, the appetite for risk is diminishing.
The same goes for emerging market stocks.
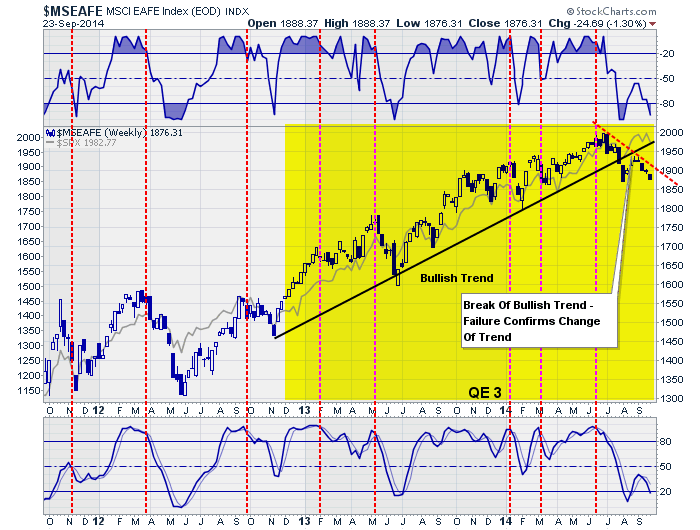
And international stocks.
Not Everything Is Equal
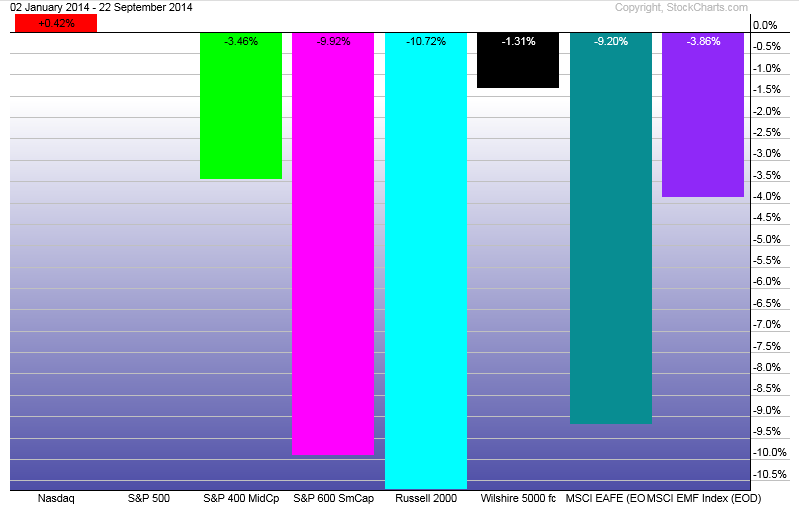
While the S&P 500 is still within its bullish trend, leadership has been extremely narrow with only 4-out-of-10 sectors posting positive performance relative to the S&P 500 this year. In other words, if you wanted to "beat the index" this year, you should have only owned Technology, Healthcare, Utilities and Materials.
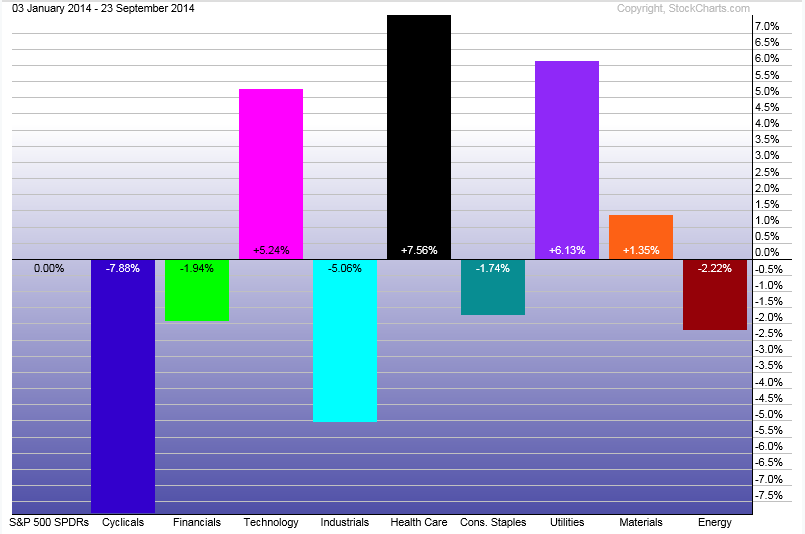
However, this is a bit deceiving because money has been frantically rotating between sectors all year chasing performance. (The chart below is of the last 30 weeks)
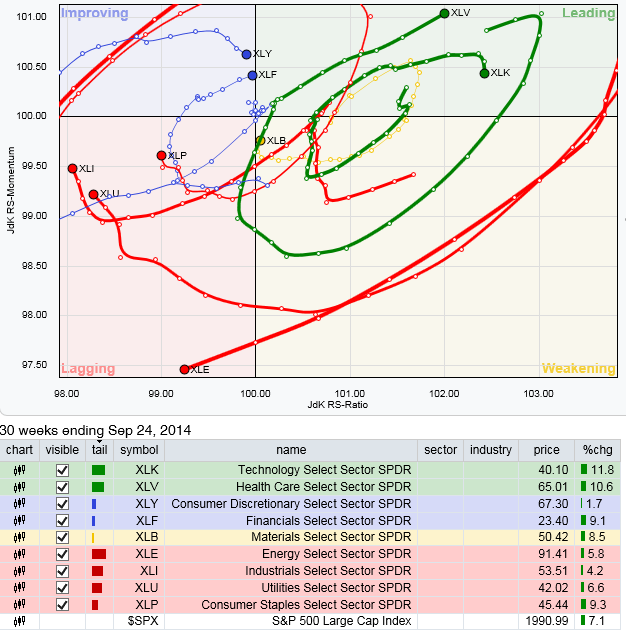
As leadership has rotated from risk (small, mid, international and emerging markets) towards the safety of domestic large capitalization U.S. stocks, the health of that leadership needs to be analyzed.
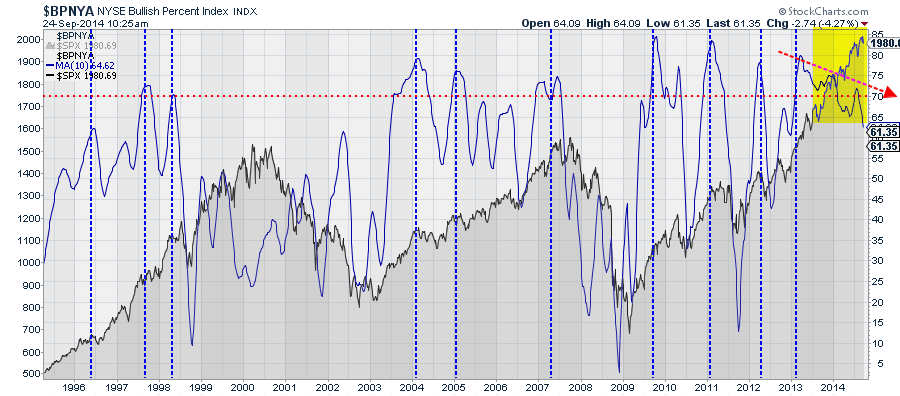
Internal Deterioration
While the S&P 500 has held its ground in light of the reduction of liquidity by the Federal Reserve, the internals of the market are beginning to show signs of weakness. The 10-week average of the number of stocks on bullish "buy" signals has deteriorated as markets have marched higher. While such deterioration does not mean that a major market correction is imminent, it is a "symptom of an increasing illness" that needs to be monitored closely.
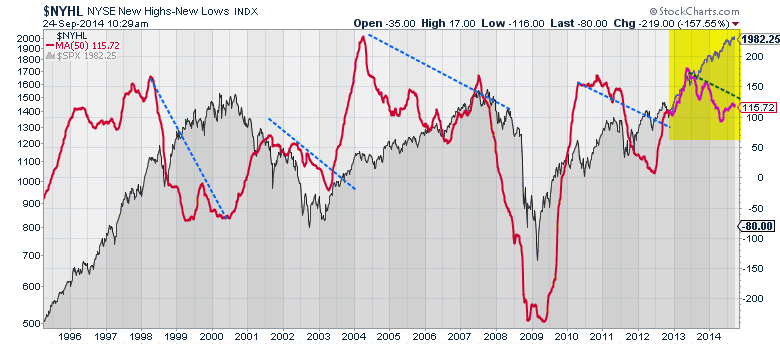
The same goes for the net number of stocks hitting new highs. (The chart below is smoothed with a 50-week moving average of net new highs)
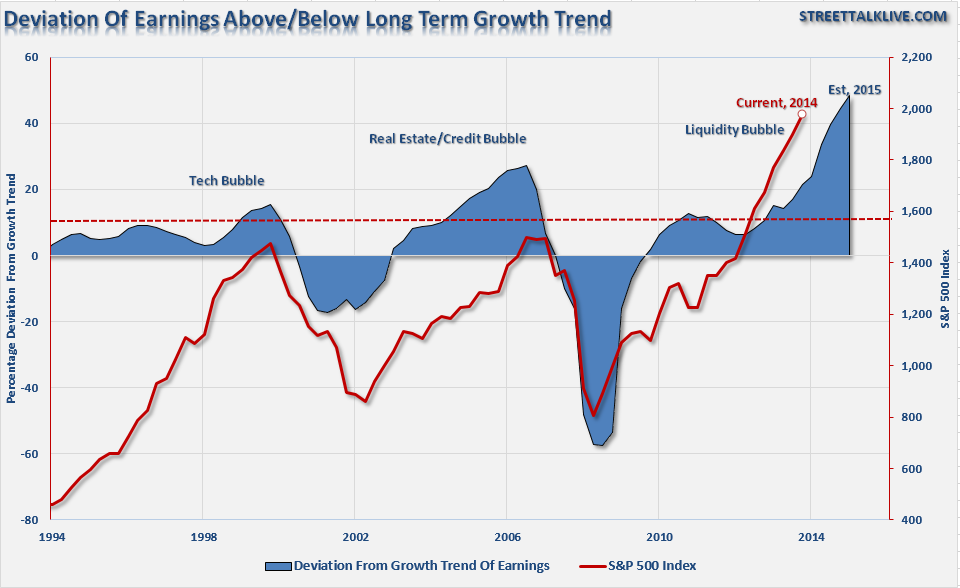
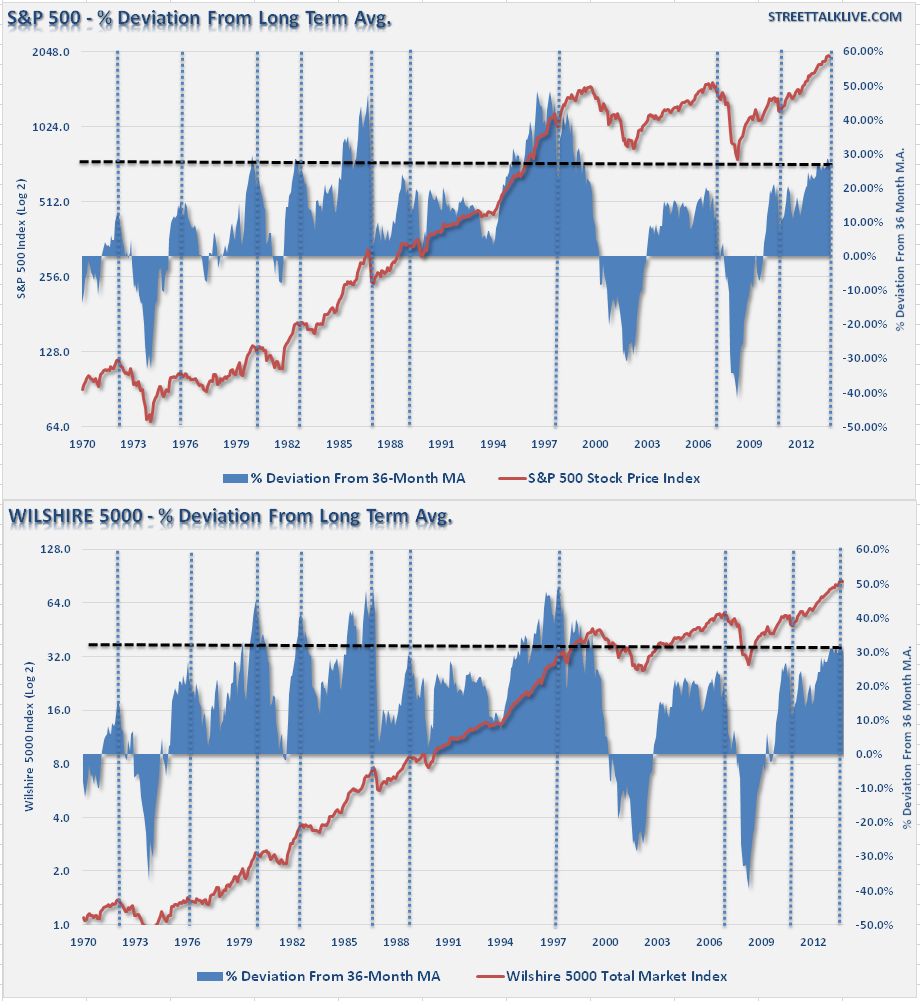
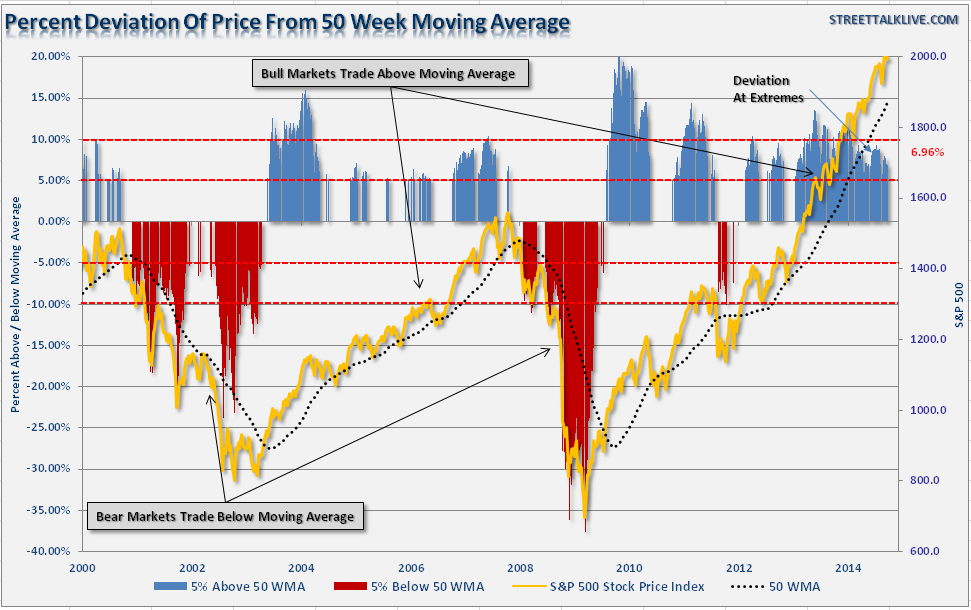
Deviation Measures
The following charts are measures of deviation from underlying trends or averages. The greater the deviation from the long-term trends or averages; the probability of a reversion back to, or beyond, those trends or averages increases. The first chart is the deviation of earnings from the underlying long-term growth trend of earnings.
The next chart is the deviation in price of both the S&P 500, and Wilshire 5000, from their respective 36-Month moving averages. For more discussion on this chart read this.
The chart below is the same basic analysis but utilizing a 50-week moving average which is a more "real-time" variation.
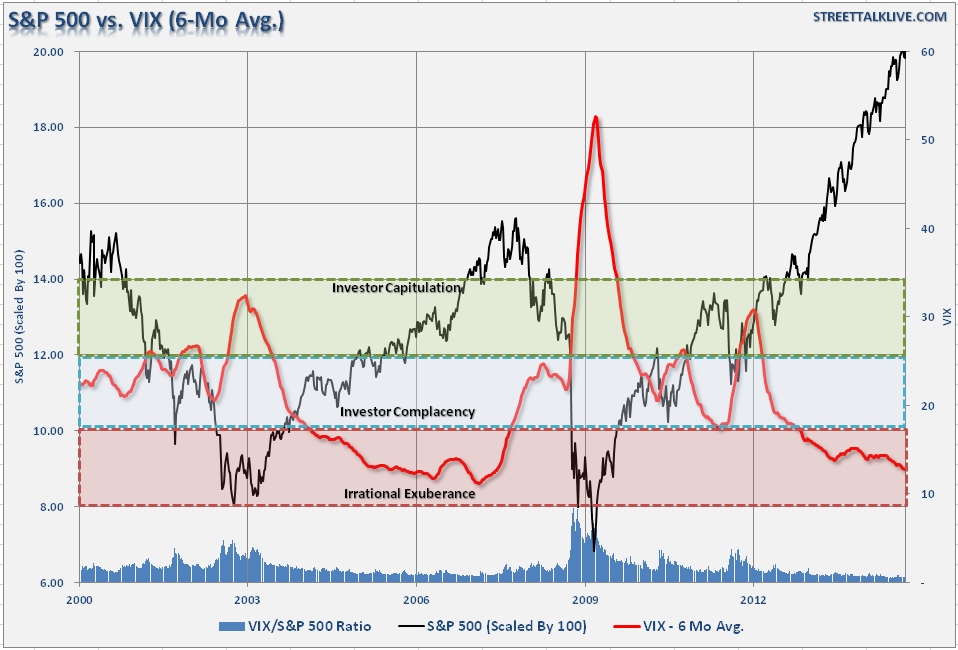
The volatility index (VIX) is representative of investors "fear" of a correction in the market. Low levels represent investor complacency and no fear of a market correction.
Reiterating The Point
While much of the mainstream media has jumped on the "buy and hold" and "passive indexing" approach to portfolio management, the reality is that most individuals will never adhere to such advice. When market corrections inevitably come, individuals will "panic" sell near the bottom of the correction only to miss out on the next advance. This has been the long and arduous history of investors as shown in repeated studies over the years.
However, by instituting a discipline of portfolio management, such emotionally driven investment mistakes can be minimized to a great degree. As stated above, the mainstream analysts misconstrue "risk" management as an "all or nothing" methodology with "buy" signals being "all-in" and vice versa. This is simply not the case.
All great investors of our time have espoused, in one form or another, the most simple rule of investing: "buy low/sell high." This is the very essence of a risk management process that takes an incremental approach to managing positions. When markets are trending higher, portfolios should be more heavily tilted towards equity exposure. When markets are declining the opposite is true. This process is the backbone of creating lower volatility, long term returns while adhering to a "buy low/sell high" discipline.
The analysis of price trends, as above, can tell us much about where we are within the current market cycle if we choose to pay attention. While it is certainly easy to be swept up in the daily advances of the stock market casino, it is important to remember that eventually the "house always wins." What has always separated successful professional gamblers from the "weekend sucker" is knowing when to step away from the table.
While it is still yet too early to tell, we may be getting close to that time.