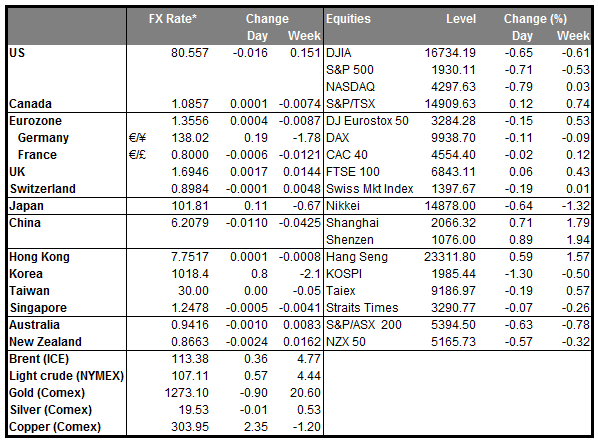
BoE Governor Carney becomes a hawk. Yesterday, the BoE Governor surprised the markets saying that an increase in interest rates is getting closer and could happen sooner than the market anticipated. The warning came as Chancellor George Osborne said that the Bank’s Financial Policy Committee will get new powers to limit mortgage lending as a surging housing market raises concerns about a potential bubble. After the growth rate of average weekly earnings for April fell short of inflation, I was among those who believed that the Bank was likely to keep rates on hold until well into next year, since there were no signs that the labor market is a source of inflationary pressure. Nonetheless, Governor Carney apparently had other plans yesterday. GBP/USD surged on his comments and is now pointing to the 1.7000 zone again. From a technical standpoint, the picture is back to the upside and a clear break above 1.7000, could pave the way towards the 1.7100 area. However, I would expect some consolidation or a pullback after the price reaches the 1.7000 barrier.
The Bank of Japan ended its two-day policy meeting today with no change in policy, as expected. In its statement, the Bank said that Japan’s economy has continued to recover moderately and that inflation expectations appear to be rising on the whole. Signs of recovery in the economy after the consumption tax increase and confident comments by Governor Kuroda have led a large number of economist to postpone, or abandon, calls for additional stimulus. According to a Bloomberg survey, 42% of economists are now forecasting that the BoJ will boost stimulus in October, displacing July as the post popular month for action, and just 58% expect the BoJ to move by the end of this year, down from 75% previously. Nonetheless we still expect the yen to weaken as the pace of base money growth in Japan is now substantially exceeding that of the US. Moreover, aside from monetary policy, Japan's current account surplus continues to fall while investors are showing renewed interest in overseas assets.
Elsewhere, the greenback was unchanged or lower against its G10 counterparts after US retail sales disappointed in May, increasing by only half of the expected pace. With two of the three months in Q2 already known, the data suggest that consumer spending probably slowed during the quarter. After a very disappointing first quarter, growth might therefore remain below estimates in Q2 too. This is a bit odd when employment is rising rapidly and I believe it will not take long before sales start accelerating again. Initial jobless claims for the week ended on June 7 rose to 317k from 313k the previous week, but since they are not far from their pre-recession lows, job growth continues at a steady clip, in my view.
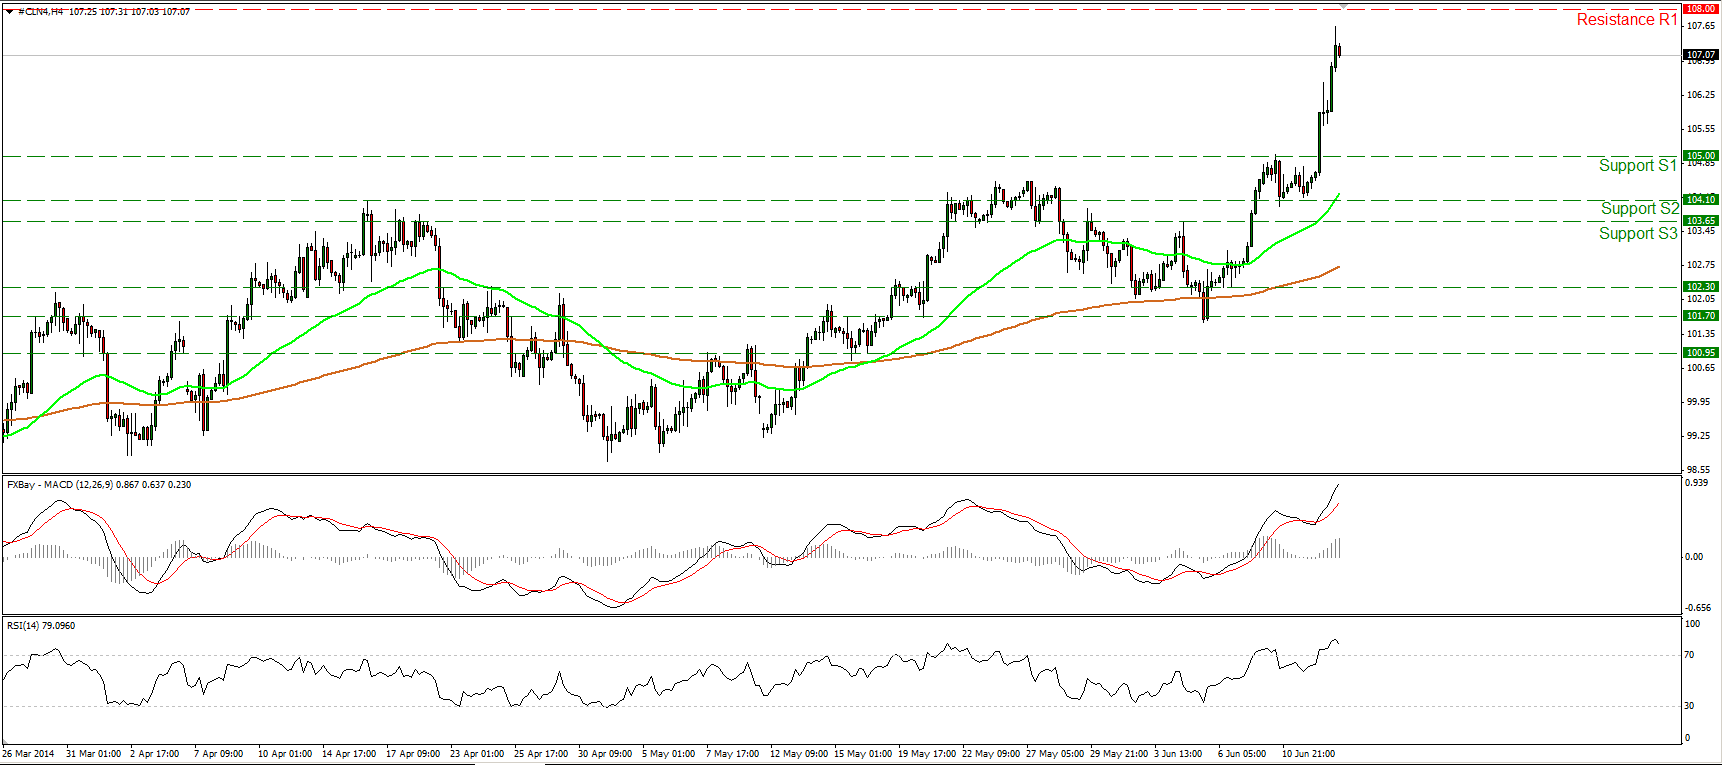
WTI rallied, breaking above the 105.00 psychological barrier as violence escalated across northern and central Iraq. The price reached levels slightly below our resistance zone of 108.00. Iraqi militants linked to al-Qaeda took control of the northern oil city of Kirkuk on Thursday and advanced closer to the capital, Baghdad. US President Obama said that Iraq would need assistance from the US to push the insurgents back. The Oil price is likely to follow events in Iraq, which we can’t forecast, but from a technical prospective, oil seems likely to continue trending higher. (see technical section below for more details)
Platinum and Palladium plunged after a South African labor union accepted a wage offer from platinum companies, increasing expectations of an end to the mining strike that started in January. In the medium term, the outlook of the metals remains to the upside since even if miners return to work soon, we will still see many months passing before returning near normal production. The South African Rand gained for the first time in four days, getting the first place among the EM currencies we track.
During the European day, we get the final CPI data for May from Germany and Italy. As usual, the forecast is the same as the initial estimate. We also get Eurozone’s trade balance for April. The bloc’s trade surplus is forecast to have fallen to EUR 16.6bn NSA from EUR 17.1bn NSA. None of these indicators is market affecting and I would expect them to pass largely unnoticed. Sweden’s unemployment rate is forecast to have declined to 8.4% from 8.7%.
In the US, the PPI excluding food and energy is forecast to have slowed to +0.1% mom in May from +0.5% mom in April. Nonetheless, this would bring the yoy rate up to +2.3% from +1.9%. We also get the University of Michigan preliminary consumer sentiment for June which is expected to have risen to 83.0 from 81.9.
We have only one speaker on Friday’s agenda. ECB Governing Council member and Bank of Spain Governor Luis Maria Linde speaks in Madrid.
The Market
EUR/USD in a retracing mode
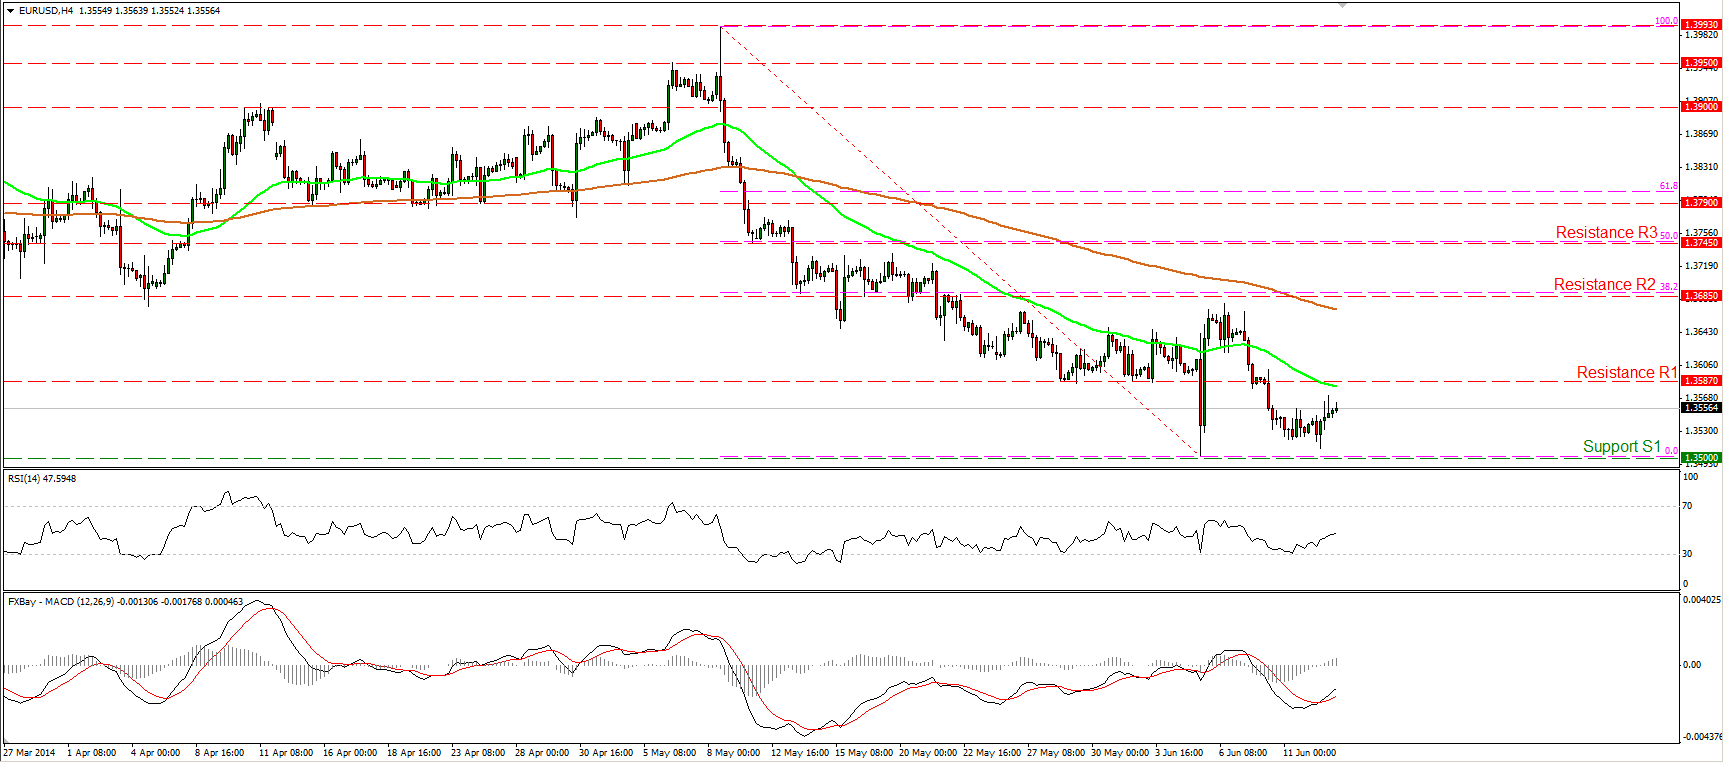
EUR/USD moved higher after finding support slightly above the support barrier of 1.3500 (S1). Considering that the MACD, although in its bearish territory, crossed above its trigger line, while the RSI continued moving higher after finding support at its 30 level, I would expect the upside wave to continue, maybe for a test near the 1.3587 (R1) level. Nonetheless, it’s too early to argue for a trend reversal, thus I would consider the recent upside wave as an upside corrective wave.
• Support: 1.3500 (S1), 1.3475 (S2), 1.3400 (S3).
• Resistance: 1.3587 (R1), 1.3685 (R2), 1.3745 (R3).
USD/JPY back below 102.00
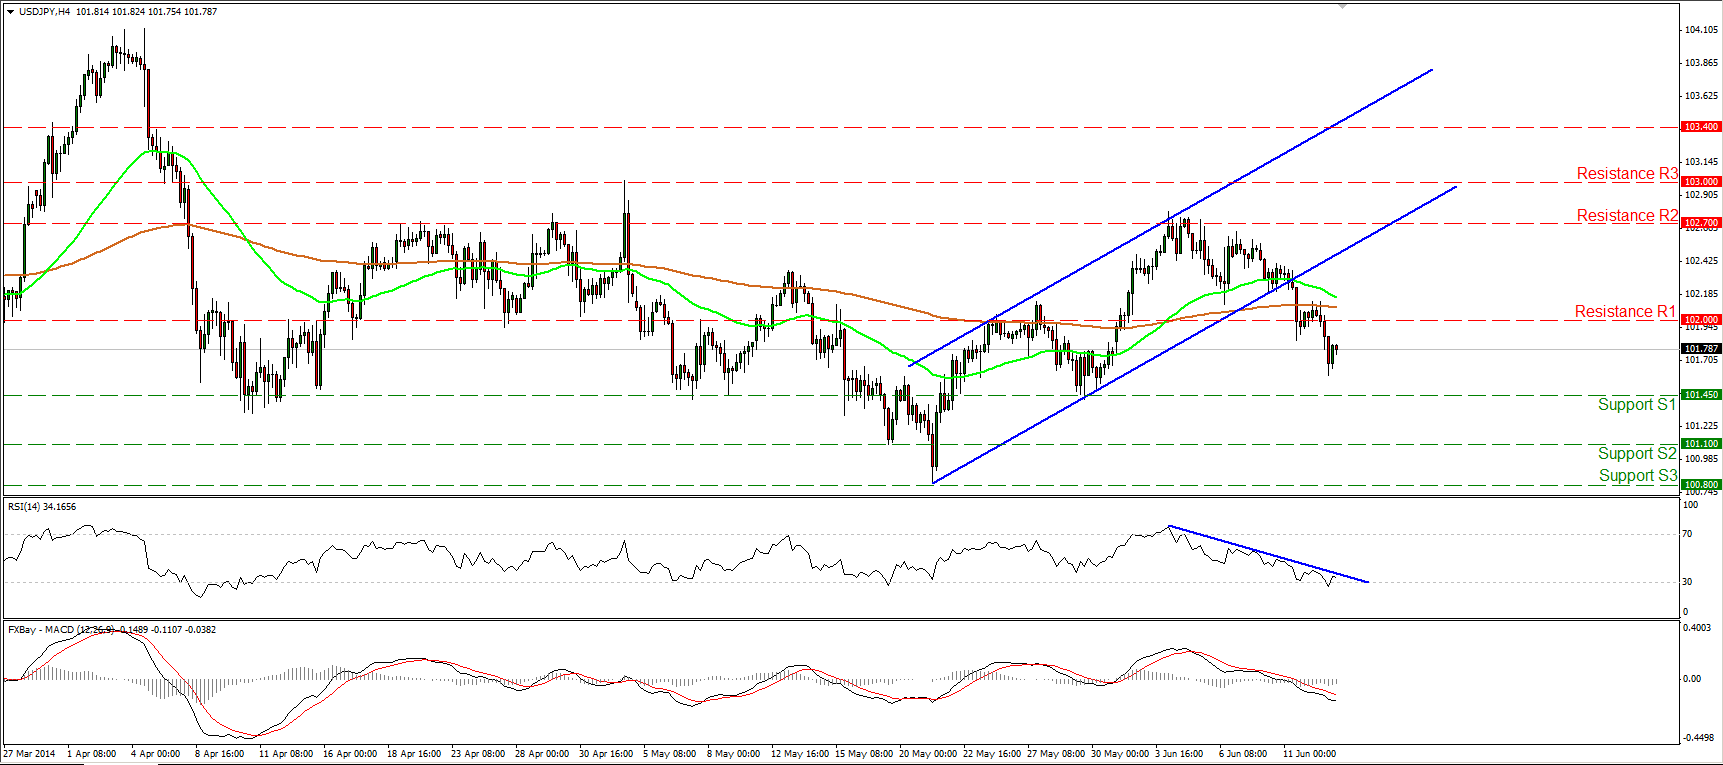
USD/JPY moved lower and managed to break the 102.00 barrier. This signals the completion of a failure swing top and turns the picture negative, in my view. I would expect the bears to extend the decline and challenge the support of 101.45 (S1). Both our momentum studies follow a downward path with the MACD remaining below both its trigger and zero lines. In the bigger picture, the longer-term path remains a trading range since we cannot identify a clear trending structure.
• Support: 101.45 (S1), 101.10 (S2), 100.80 (S3).
• Resistance: 102.00 (R1), 102.70 (R2), 103.00 (R3).
EUR/GBP reaches 0.8000
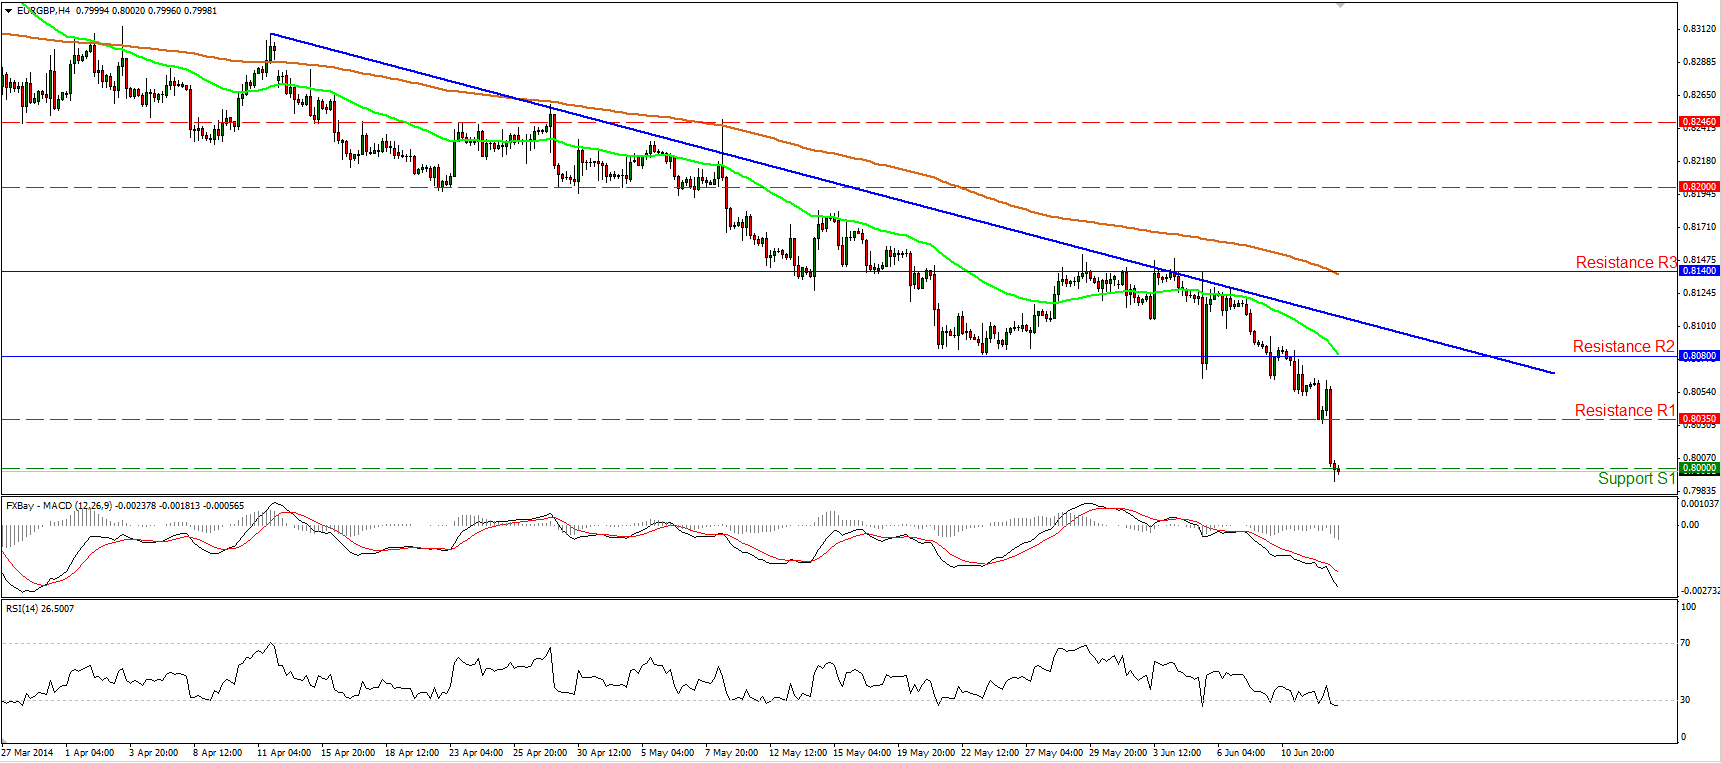
EUR/GBP turned the picture negative after breaking below the 0.8080 zone. The plunge was halted by the key zone of 0.8000 (S1), where a clear dip could pave the way towards the next support barrier at 0.7880 (S2). The MACD remains below both its trigger and zero lines, confirming the accelerating bearish momentum, but the RSI seems ready to exit oversold conditions. As a result, I cannot rule out some consolidation or a bounce before the bears prevail again. As long as the rate is trading below the blue downtrend line and below both the moving averages, I see a negative picture.
• Support: 0.8000 (S1), 0.7880 (S2), 0.7755 (S3).
• Resistance: 0.8035 (R1), 0.8080 (R2), 0.8140 (R3).
Gold breaks above 1268
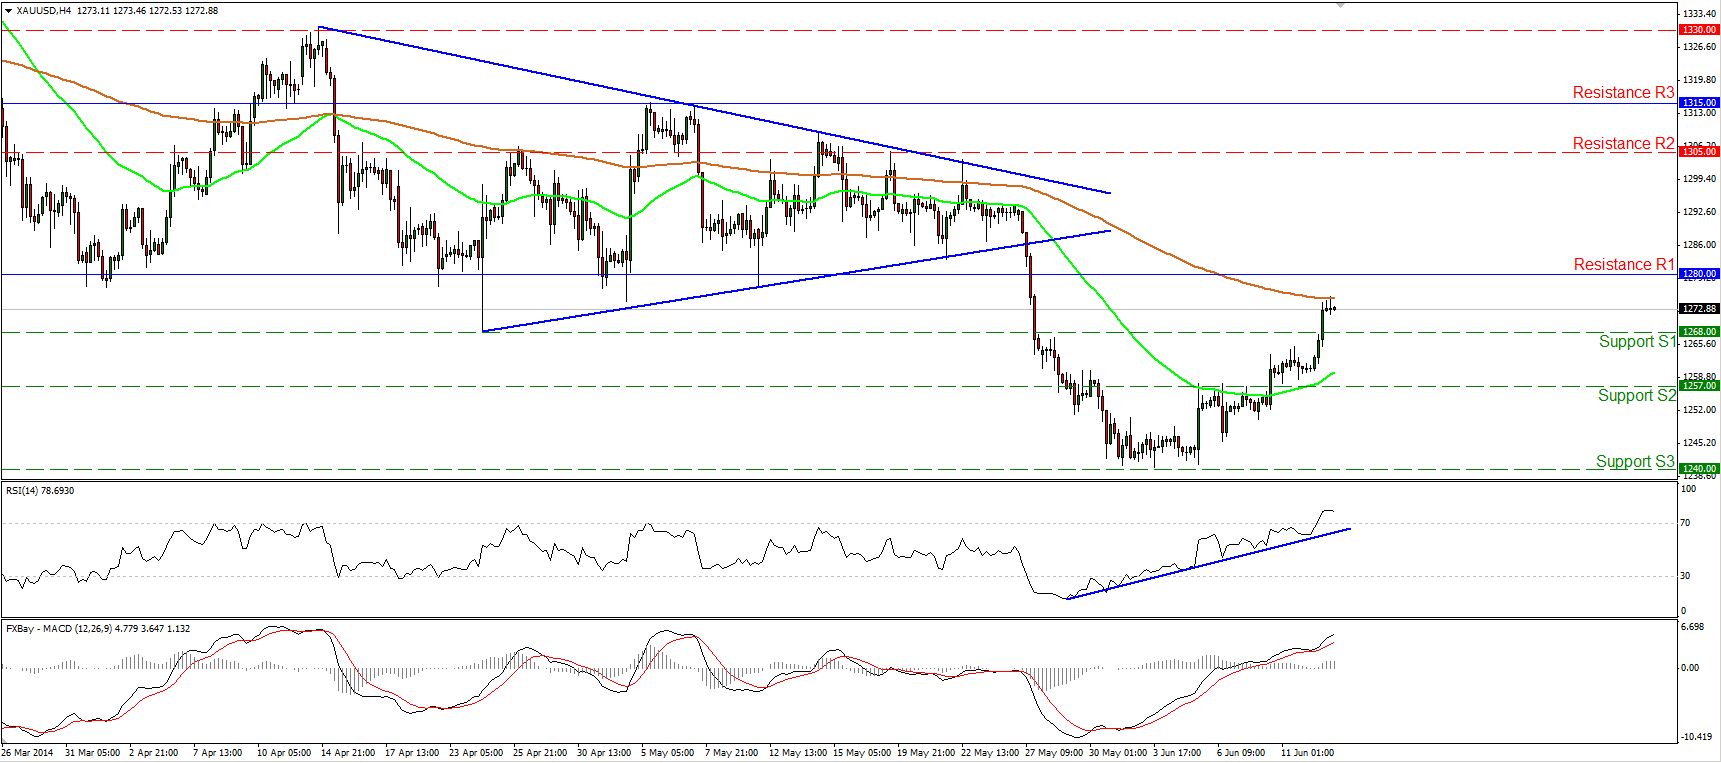
Gold moved significantly higher on Thursday, breaking above the 1268 barrier but the advance was halted by the 200-period moving average. The MACD managed to remain above both its trigger and zero lines, pointing up, but the RSI lies within its overbought territory, showing signs of topping. Considering the mixed signals provided by our momentum studies, I would adopt a neutral stance for now. A move above the resistance of 1280 (R1), which coincides with the 50-day moving average, could turn the picture positive and pave the way towards the 1305 zone, slightly below the 200-day moving average.
• Support: 1268 (S1), 1257 (S2), 1240 (S3) .
• Resistance: 1280 (R1), 1305 (R2), 1315 (R3).
WTI heading toward the 108.00 zone
WTI surged on Thursday, breaking above the psychological barrier of 105.00. The price is now trading slightly below our resistance zone of 108.00 (R1). I would expect the price to challenge that zone, and if the bulls are strong enough to overcome it, they may trigger extensions towards the 110.00 (R2) area. The MACD, already in its bullish territory, crossed above its signal line, confirming the accelerating bullish momentum. Nonetheless, the RSI lies within its overbought territory and is pointing down, thus I cannot rule out a pullback in the near future, before the bulls prevail again.
• Support: 105.00(S1), 104.10 (S2), 103.65 (S3).
• Resistance: 108.00 (R1), 110.00 (R2), 112.00 (R3).

