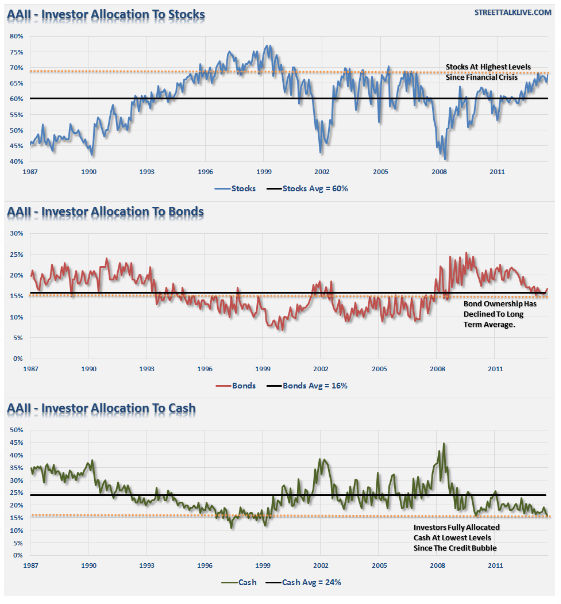
I recently highlighted some figures indicating that the US public was at or near a crowded long in equities (see 3 reasons to get more cautious on stocks). Here is the chart from Lance Roberts showing AAII equity allocations at levels roughly equal the pre-2008 top and cash levels at low extremes roughly equal to the pre-Lehman Crisis lows.
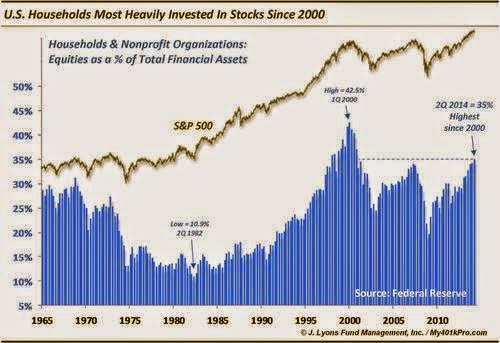
As well, there was the chart from Dana Lyons indicating a similar crowded long reading in US equities:
An apathetic public?
By contrast, Russ Koesterich of The BlackRock Blog told a story of Americans who are afraid of the stock market (via Business Insider):
During the bull market of the last five years, U.S. stocks, as measured by the S&P 500, have generated total returns of 233%. So, you would think most investors would be embracing equities.
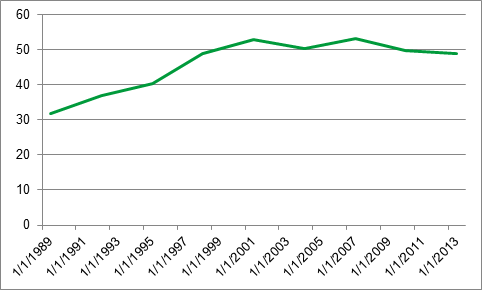
But while stocks represent a larger share of household financial assets than they did five years ago, the share of U.S. adults who own stocks remains stuck at multi-year lows.
Share of US households holding stocks
As well, Josh Brown recently wrote a post entitled How can you have euphoria when nobody gives a sh*t? Unlike the Tech Bubble of the late 1990`s when everyone was partying like Qualcom would go up 1000% a year, Brown cited a Gallup poll indicating that only 7% of Americans knew that the stock market was up 30% last year:
This week we learned that only 7% – SEVEN PERCENT – of Americans are aware that the US stock market went up by 30% last year.
This is quite a mania – a mania of apathy.
Subsequent to that post, Brown tweeted the following contradictory message:
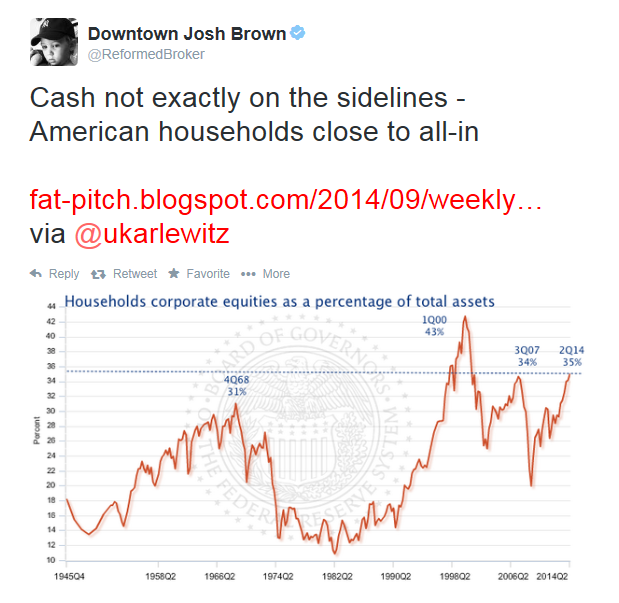
An apparent contradiction
How can both sets of analysis be true? Can individual investors BOTH be in a crowded long AND be afraid and apathetic about the stock market?
The superficial explanation is that while individual investors are long equities, they remain jittery and are quick to bail whenever risk aversion rises. That`s why we have seen frequent short but shallow pullbacks marked by spikes in fear.
I came up with a better explanation once I started to dive into the data. In effect, both assertions are true. The average American remains apathetic and unaware of the bull market while fully invested. That`s because surveys like Gallup are equal weighted, that is to say they survey all Americans, while surveys like the AAII Asset Allocation Survey is more tilted towards a population who matter - those with money.
The Federal Reserve Survey of Consumer Finances is very revealing in that respect. Koesterich pointed out that US household holdings of equities have hardly budged since the Great Financial Crisis, I will use the period from 2007 to the present as my framework for analysis.
The chart below expands on the chart shown by Koesterich above by breaking down the Percent of families with stock holdings by income groupings. For the period from 2007 to 2013, only the top 10% of households saw holdings rise, while all other groups saw their holdings fall. Since outfits like AAII measure overall equity allocations and it's the 10% that have most of the stock holdings, it is no surprise that we see weighted equity holdings rise.
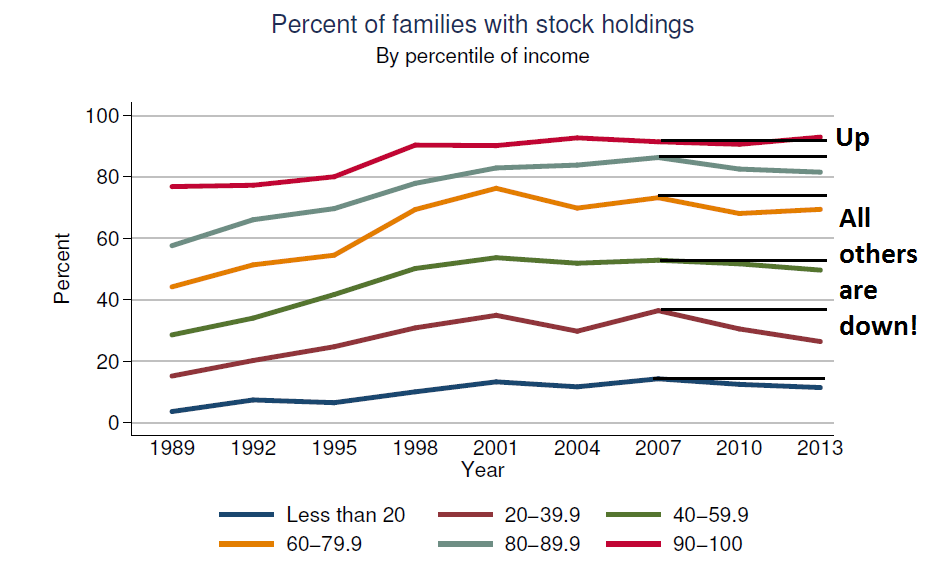
The above chart shows the percentage of households with stock holdings. The chart below shows the median value of stock holdings for households that reported non-zero holdings by income group. First of all, note the disparity in the magnitude of holdings. The value of the holdings of the top 10% group dwarves all other groups, including the next 10% by income.
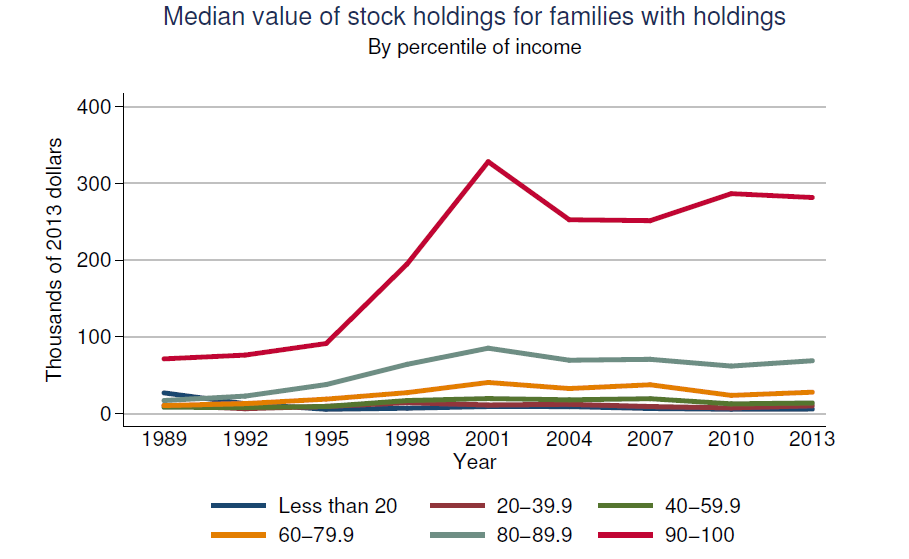
Since the vertical scale of the above table is a little hard to read as you go down the income group, here is the same data in table form. From 2007 to 2013, only the top decile and the second quartile of households that reported stock holdings saw their median portfolio value increase. Given the pattern shown by the other charts and tables, the gain by the second quartile is likely a statistical anomaly.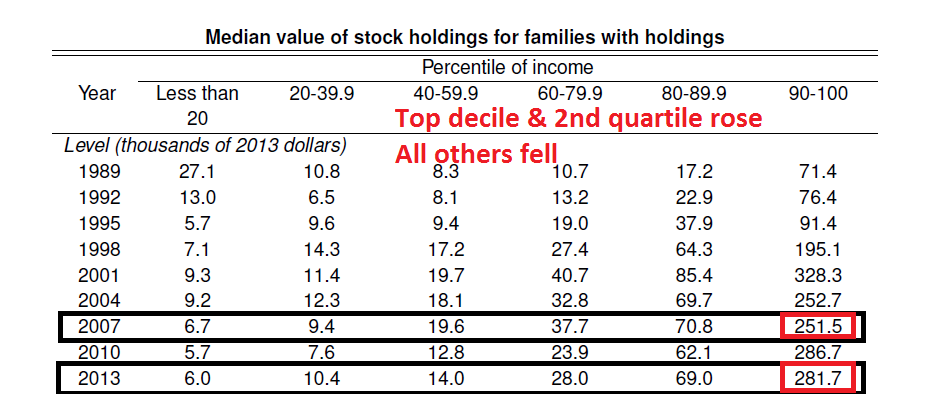
Since:
- The top 10% have most of the money;
- Surveys like the AAII Asset Allocation Survey focuses on the people with the money; and
- The bottom 90% appeared to have lost ground in their equity portfolio holdings since 2007
To summarize, this chart from the Fed, which is weighted by dollar invested and not equal weighted by population, tells the story: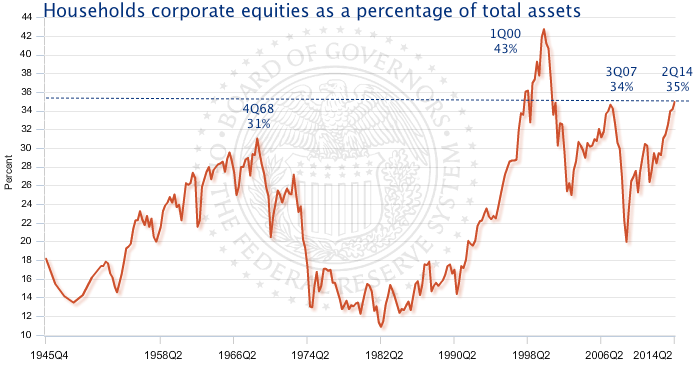
My conclusion is the people who matter, i.e. those with the money, are fully invested in equities. By contrast, those who don't have any money are either apathetic or possibly afraid of stocks. There may be further room for more increased public participation by other 90% as the economic recovery strengthens, but that would be a long-shot scenario.
Could public participation widen?
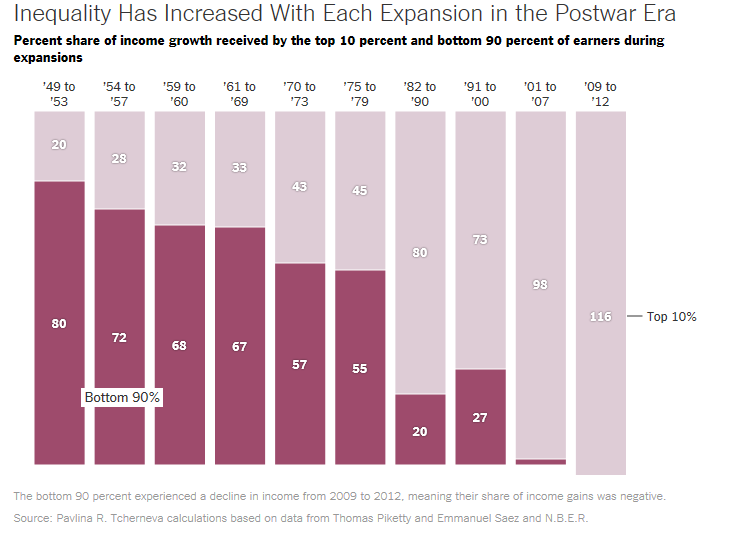
Consider the long-term trend in income gains. Neil Irwin, writing in the New York Times, pointed out that the trend has been that income gains have accrued more and more to the top 10%:
In fact, most of the income gains have gone to the top 1%:
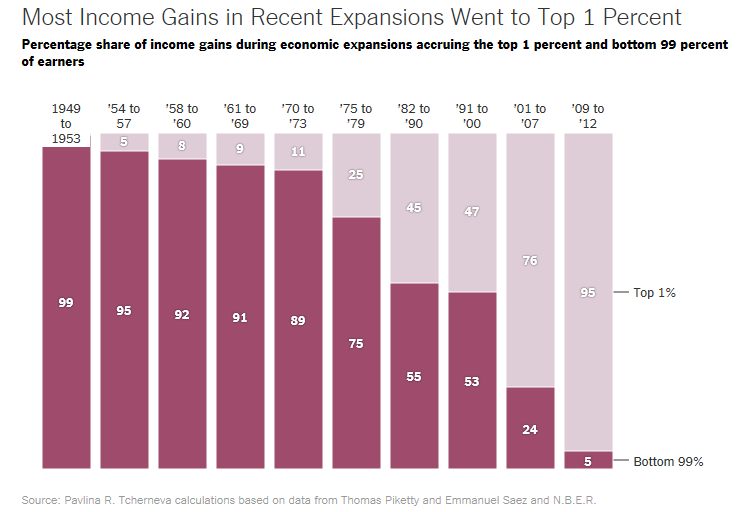
This post is not intended to be a discussion about inequality or fairness of how the pie is sliced up. However, given the trends in the post-war era, and the fact that the richest segment of America are already fully invested in equities, do you really want to bet on widening public participation as incremental demand to drive equity prices higher from here?
Disclosure: Cam Hui is a portfolio manager at Qwest Investment Fund Management Ltd. ("Qwest"). This article is prepared by Mr. Hui as an outside business activity. As such, Qwest does not review or approve materials presented herein. The opinions and any recommendations expressed in this blog are those of the author and do not reflect the opinions or recommendations of Qwest.
None of the information or opinions expressed in this blog constitutes a solicitation for the purchase or sale of any security or other instrument. Nothing in this article constitutes investment advice and any recommendations that may be contained herein have not been based upon a consideration of the investment objectives, financial situation or particular needs of any specific recipient. Any purchase or sale activity in any securities or other instrument should be based upon your own analysis and conclusions. Past performance is not indicative of future results. Either Qwest or Mr. Hui may hold or control long or short positions in the securities or instruments mentioned.
