Trend Model signal summary- Trend Model signal: Risk-on
- Direction of last change: Negative
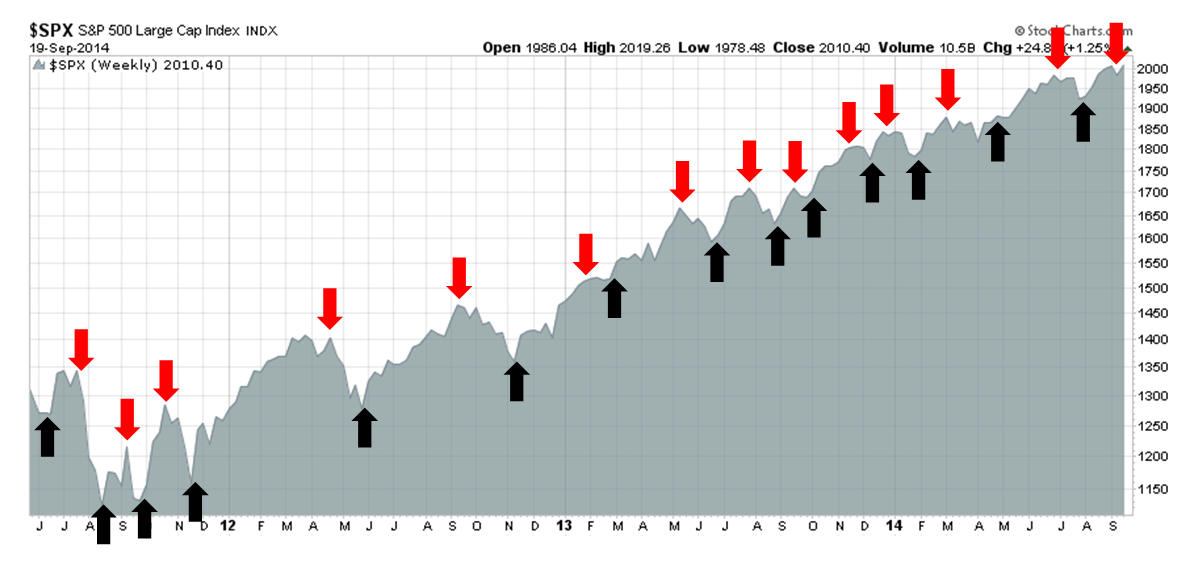
The actual historical (not back-tested) buy and sell signals of the Trend Model are shown in the chart below:
Equities poised for a pullback
Despite the positive performance shown by US equities last week, I continue to believe that they are poised for a pullback for the following reasons:
- High valuation;
- Excessive risk appetite and crowded long positions in pockets of the market; and
- Possible growth scare
The first two are latent risks, which can lurk for a long time without any negative consequences, much like Bank of Governor Stephen Poloz's metaphor about the cracked tree in the back yard when he talked about the Canadian real estate market:
It’s like if the tree in the backyard has a crack in it, you worry it’s vulnerable to a storm. But if no storm happens, it goes on and on, and maybe eventually strengthens through growth. If the right storm comes along and knocks it onto your neighbour’s house you’ve got a problem.
The the possible growth scare scenario is the catalyst that could wake the hibernating bears.
Equities richly priced
I have written before about how US equities appear expensive on a P/E, P/B and dividend yield viewpoint (see More evidence of a low equity return outlook) and those conclusions haven`t changed. Valuations are elevated, though not crazy high, which indicates that investors should lower their long term equity return expectations.
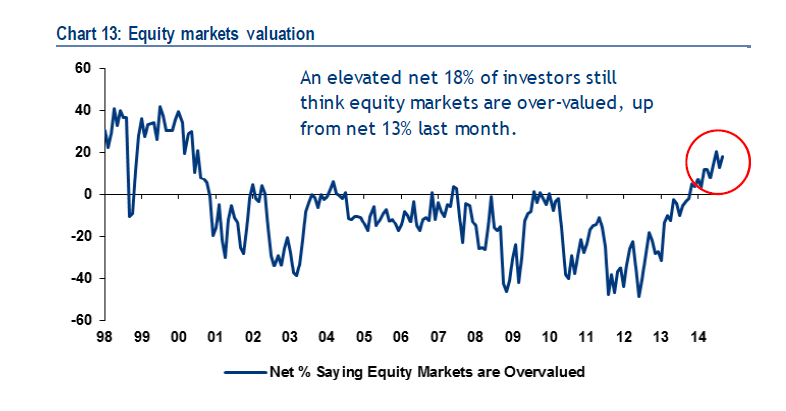
My observations were confirmed by the latest BoAML Fund Manager Survey which showed that a consensus of fund managers believed that equities are richly valued. Note that these readings have not been this high since the NASDAQ bubble of the late 1990s:
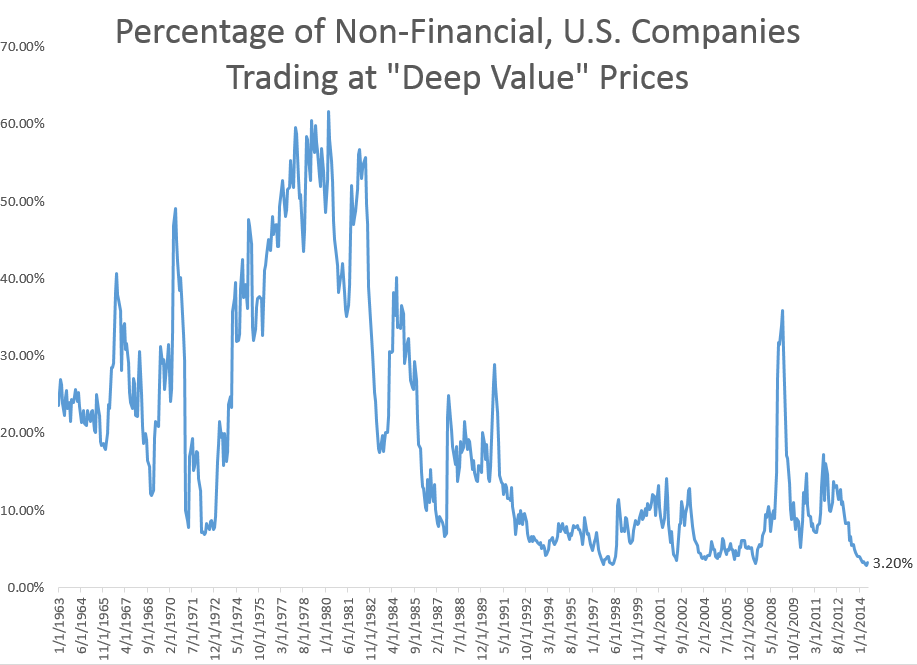
It's not just deep value investors that are having trouble finding cheap stocks. In a WSJ interview, venture capitalist Bill Gurley warned about the stretched valuations and frothiness in Silicon Valley:
Silicon Valley is a risk-driven place. But over the past year, it may have taken on more than it can handle, according to one prominent venture capitalist.
"I think that Silicon Valley as a whole, or that the venture-capital community or startup community, is taking on an excessive amount of risk right now—unprecedented since '99," said Bill Gurley, a partner at Benchmark, referring to the last tech bubble.
Here are some selected quotes from that interview:
In '01 or '09, you just wouldn't go take a job at a company that's burning $4 million a month. Today everyone does it without thinking...
Right now, the cost of capital is super low here. If the environment were to change dramatically, the types of gymnastics that it would require companies to readjust their spend is massive. So I worry about it constantly...
The most obvious one is just the acceptable burn rate. And that can be seriously, negatively reinforced by the capital market. In the software-as-a-service world, where the risk is potentially among the highest, Wall Street has said it's OK to lose tons of money as a public company. So what happens in the board rooms of all the private companies is they say, "Did you see that? Did you see they went out and they're losing tons of money and they're worth a billion. We should spend more money." And there are people knocking on their door saying, "Do you want more money, do you want more money?"
In a recent letter to investors, Seth Klarman also warned about increasing complacency in the market (emphasis added):
We don’t know now (nor do we ever know) what the overall market will do. As we’ve discussed in recent letters, there are reasons for investors to be frightened but also numerous individual opportunities worth seizing. Today’s limited opportunity set means that we are still holding sizable cash balances, about 35% of the portfolio at June 30. This dry powder will become more valuable if the markets become more turbulent.
Equity markets continue to hit successive record highs, volatility remains strikingly low in equity and most other markets, and inflation is ticking higher. Investors have clearly grown weary of worrying about risky scenarios that never seem to materialize or, when they do, don’t seem to matter to anyone else. U.S. GDP, for example, was recently restated to minus 2.9% for the first quarter of 2014. Normally, this magnitude drop signals recession. Equities, nevertheless, marched relentlessly higher.
In today’s ebullient markets, we see many investors ratcheting up their own risk levels–buying substandard credits and piling up leverage are two favorite methods–in an attempt to generate near-term performance.
He concluded:
It’s not hard to reach the conclusion that so many investors feel good not because things are good but because investors have been seduced into feeling good—otherwise known as “the wealth effect.” We really are far along in re-creating the markets of 2007, which felt great but were deeply unstable when shocks started to pile up. Even Janet Yellen sees “pockets of increasing risk-taking” in the markets, yet she has made clear that she won’t raise rates to fight incipient bubbles. For all of our sakes, we really wish she would.
Crowded long in risky assets
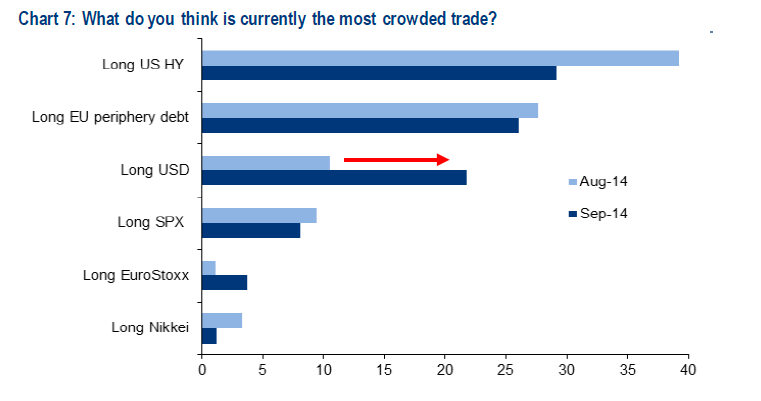
To confirm Klarman's view, I am seeing pockets of crowded long positions in risky assets. The BoAML Fund Manager Survey shows that the two biggest crowded long trades are US HY, or junk bonds, and eurozone peripheral debt, which could cause concern for the market in light of the disappointing TLTRO results.
As an example of how pervasive risk taking is in the fixed income market, consider this Bloomberg report about how an establishment figure like Bill Gross of PIMCO raised returns using a combination of financial leverage, derivatives and peripheral European and emerging market debt:
Bill Gross is relying on derivatives rather than Janet Yellen to raise his returns on government bonds.
The co-founder of Pacific Investment Management Co. sold most of the $48 billion of U.S. Treasuries held by his $221.6 billion Pimco Total Return Fund (PTTRX) in the second quarter, replacing them with about $45 billion of futures, according to an August filing. The contracts require small up-front payments, freeing up money for Gross to invest in higher-yielding securities including Brazilian, Spanish and Italian debt.
“They are taking the cash and buying all these peripheral bonds that have a lot of spread on them relative to Treasuries,” a trend that is occurring across the money-management industry, said Erik Schiller, a Newark, New Jersey-based senior money manager at Prudential Fixed Income. “It is levering their fund.”
As well, read this Bloomberg report on how investors, desperate for yield, are plunging into the illiquid world of bank loans.
Aside from the excesses of institutional behavior, the American individual investor is nearing a crowded long position in equities. Lance Roberts recently pointed out that that US households have equity positions equal to pre-Lehman Crisis levels and cash allocations are at near historic lows.
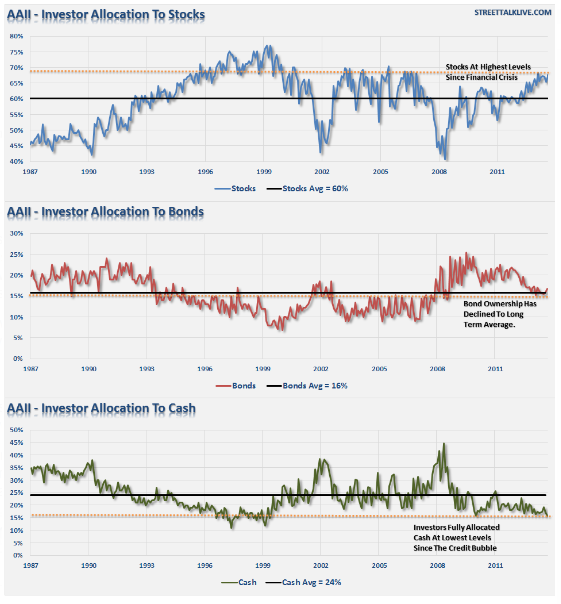
Dana Lyons confirmed the conclusions of the AAII asset allocation survey with this analysis and pointed out that US households are most invested in stocks since 2000, the year of the NASDAQ peak.
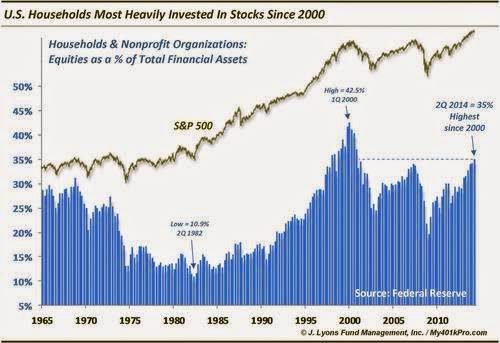
His take is that while risk levels are high, there could be more upside:
What is the significance of the current reading? As we mentioned, it is the highest reading since 2000. Considering the markets are at an all-time high, this should not be surprising. In fact, while most of the indexes surpassed their prior peaks in early 2013, household stock investment did not surpass the 2007 highs until the first quarter of this year. The financial crisis put a dent in many investors’ psyches (along with their portfolios) and they’ve been slow to return again. However, along with market appreciation, investor flows have seen at least streaks of exuberance over the past 18 months, boosting investment levels.
Yes, there is still room to go (7.5 percentage points) to reach the bubble highs of 2000. However, one flawed behavioral practice we see time and time again is gauging context and probability based on outlier readings. This is the case in many walks of life from government budgeting to homeowner psychology to analyzing equity valuations. The fact that we are below the highest reading of all-time in stock investment should not lead one’s primary conclusion to be that there is still plenty of room to go to reach those levels.
Having set the stage that, in effect, there is a crack in the backyard tree, the tree could stay up indefinitely. In order for the tree to go down, you need a storm.
A gathering storm?
A possible storm warning comes from the BoAML Fund Manager Survey indicating that global growth expectations are starting to roll over:
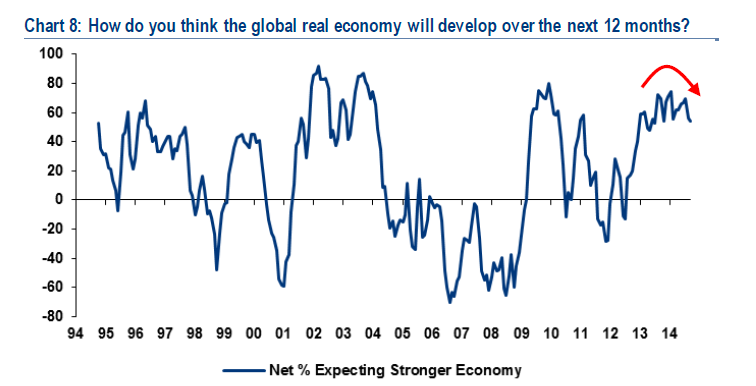
What's even more disturbing is the fact that growth seems to be slowing across the board in virtually all countries. Let me go through the three major regions in the world, one by one:
China: Stimulated but not aroused
Let`s start with China. Last week, the news that PBoC injected 500b yuan, or roughly USD 81b, into the banking system rallied the market, but excitement petered out later in the week as the move was interpreted as being done for technical reasons instead of a broadly based stimulus program. Bloomberg recounts the details here:
Sina.com reported that the PBOC provided the funds under a program called the standing lending facility, introduced last year as a collateralized provision of funds to meet large-scale demands for financial institutions’ long-term liquidity and to help address fluctuations in money-market rates.
While the action was probably driven by considerations including economic weakness and liquidity volatility around the weeklong National Day holiday that starts Oct. 1, the fact that the PBOC used the SLF instead of a cut in banks’ reserve requirements suggests that the “central bank does not want the market to interpret it as a clear sign of monetary easing,” JPMorgan Chase + Co. economists wrote in a report.
The central bank has left reserve requirements for the largest banks and benchmark interest rates unchanged for more than two years.
Sara Hsu's article entitled "Stimulated but not aroused" summed up the recent PBoC targeted stimulus perfectly:
China’s central bank recently implemented a limited stimulus by injecting 100 billion RMB into each of the top five banks. The stimulus took the form of direct injections in order to prevent other areas of the economy (such as real estate) from heating up once again. However, given China’s restructuring status, it will likely take more than a stimulus to arouse the economy back to strong growth levels. For this, China can look to its own reform plans to alter the sectoral balance of the economy.
She believes that Beijing needs to press on with financial reforms:
To combat its own malaise, China needs real reforms in targeted industries. In general, the state sector remains too pervasive, and challenges to the growth of private sector enterprises are difficult to surmount. In contrast to what other analysts have asserted, the reform process does not have to be stalled in order to combat slowing growth. Slowing growth can only be addressed in a meaningful way by changing policies to promote employment and the expansion of particular sectors. Economic resuscitation and long-term growth need not, and should not, be mutually exclusive.
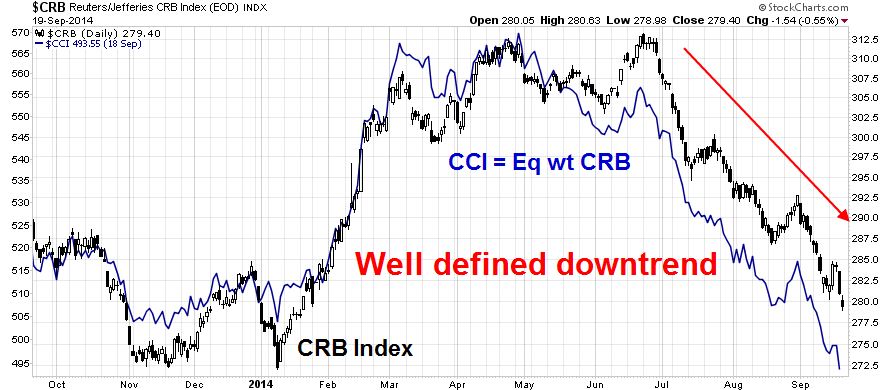
The market barely reacted to the news of the limited stimulus program, as commodity prices (via the CRB Index, which represent a real-time measure of the health of the Chinese economy, are having trouble breaking out of their well-defined downtrend:
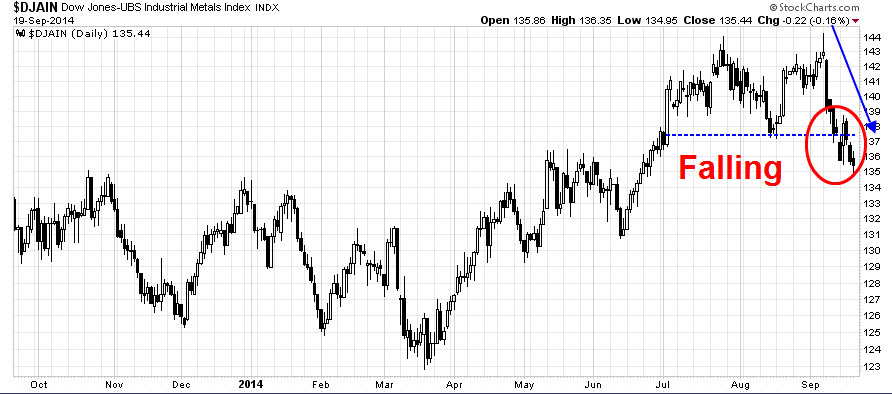
The industrial commodity complex, whose prices held up fairly well, weakened and breached a key technical support level:
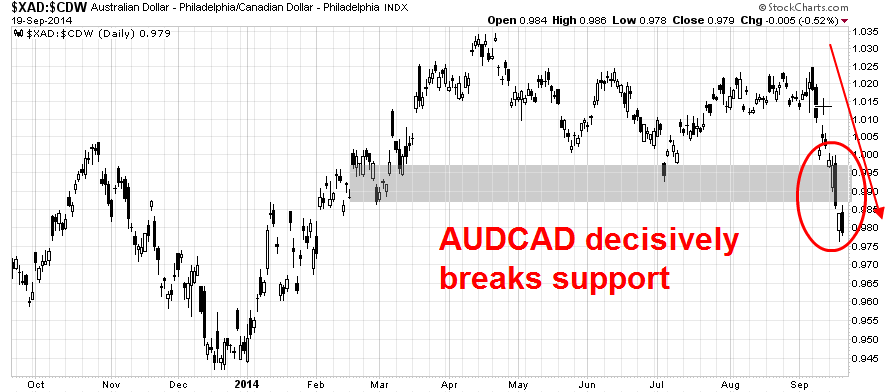
China bulls may point to the fact that commodity prices face a headwind because of the strength in the US Dollar Index, a fact that I recently highlighted (see Overbought USD = Commodities poised to rally). One way of untangling the China effect from the USD effect on commodity prices is to focus on the AUD/CAD exchange rate. Both Australia and Canada are resource based economies of similar size, but Australia is more China sensitive while Canada is more US sensitive. As the chart below shows, the AUD/CAD shows a technical breakdown through a key support level and it is falling with little sign of a bottom in sight.
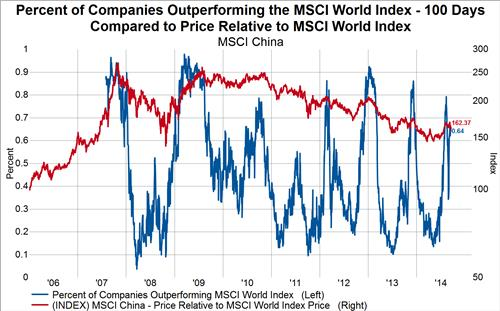
What about the recent rally in Chinese stocks? Isn`t that an indication that the markets remains upbeat about China? Don`t count your chickens before they`re hatched. Analysis from GaveKal suggests that the Chinese stock rally may be due for a pause:
MSCI China has outperformed the developed market stock index (the MSCI World Index) by about 11% since the middle of March. Over that period the percent of stocks outperforming the World Index increased from a paltry 14% to an elevated 79% (blue line in the chart below). In the past, when the percent of stocks in the MSCI China outperforming the MSCI World Index reached around 80% the relative outperformance was all but over and a new downtrend resumed. We are careful not to call for a renewed downtrend in Chinese stocks, but perhaps they are ready for a breather.
Bottom line: Don`t count on China for any help with global growth expectations.
No European growth boost
The bulls got a boost late last week when Scotland voted 'No' to independence (and my daughter breathed a sigh of relief because her biggest worry, who would get Hogwarts in the divorce, evaporated). Unfortunately, the relief rally was brief (via The Telegraph):
Sterling and the stock market rose, of course — but not by much in the end. The FTSE 100 didn’t set any records, as some had hoped, and the pound soon began to reverse its gains.
Why? The first drag was expectations. The financial and betting markets had been pricing in a No vote with a very large probability; once again, it was confirmed that the weight of money is far more powerful a barometer of public opinion than the analysis of specialist pundits. The wisdom of the crowd — at least the cash-rich, let’s put our money where our mouth is variety — does work. The pound recovered the ground it had recently lost — but within hours, traders were once again focused on all of the usual big global macro issues.
Another reason was because the City was looking ahead to the prospect of Brexit (emphasis added):
The business community faces several other issues. In the long-run, the chances of a Brexit — a UK exit from the EU — are now higher than they were, though not as high as if Scotland had voted Yes. It is clear that campaigners can make huge headway even if the establishment is against them. Expect the Out campaign to use a similar strategy to that embraced by Mr Salmond — though with actual facts and genuine arguments this time, rather than bluff, bluster and denial.
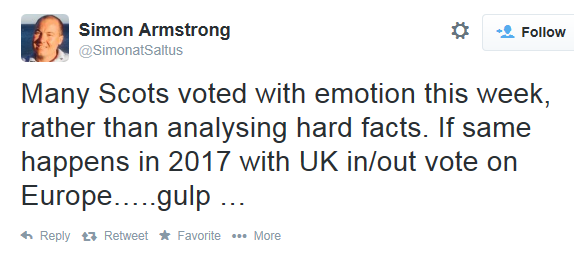
It appears that Brexit fears are surfacing, as evidenced by this tweet from Simon Armstrong of Saltus Investment Partners:
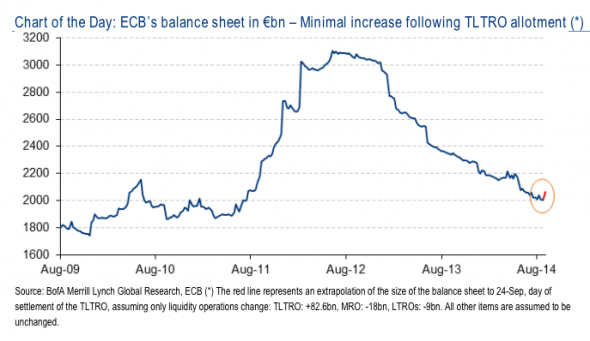
Across the English Channel, the ECB's TLTRO auction was a major disappointment as the amounts were far less than expected. TLTRO injected €83b into the eurozone banking system, but the banks promptly repaid €20b of LTRO money the next day. The market's hope that TLTRO would be a QE program that would significantly expand the ECB balance sheet were shattered.
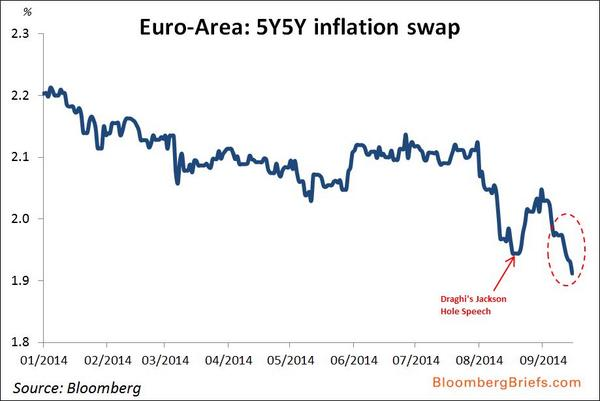
Eurozone inflationary expectations continued to tank:
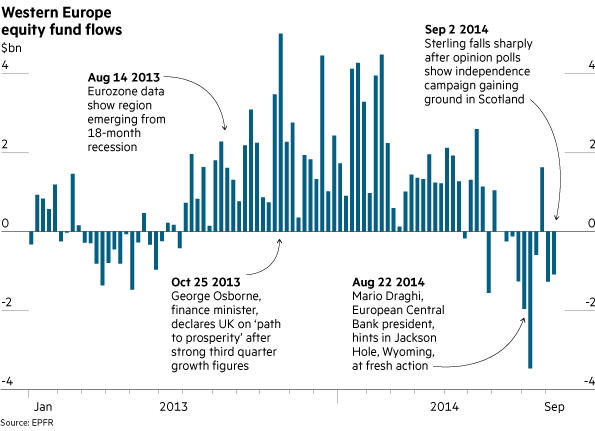
The FT highlighted the fact that money has been coming out of European equities. These recent developments are likely to exacerbate the trend toward further withdrawal.
I had written that since the intent of the TLTRO is to stimulate local businesses and SMEs, European small caps may benefit (see Time for European small caps to shine?). Oh well, in light of the disappointing TLTRO results, maybe next time.
Don`t expect Europe to contribute positively to global growth.
Slowing US growth?
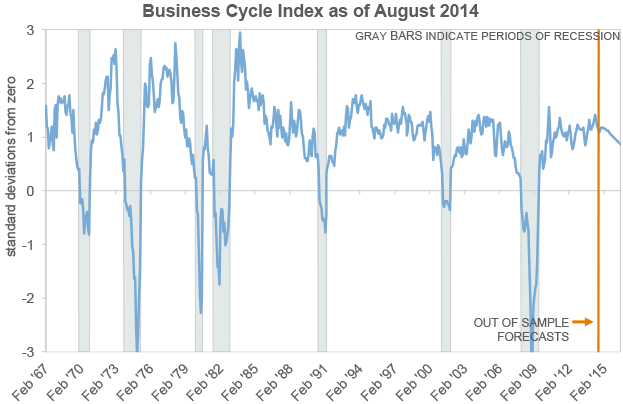
Across the Atlantic, the US growth outlook is starting to lose some steam too. The momentum in Russell Investments' Business Cycle Index is slowing down (ht The Big Picture). Russell does, however, note that the US economy is far from a recession and dismiss the weakness as "noise", at least for the time being:
While the BCI model still shows the U.S. economy has a very low probability of recession and is on a path of moderate growth amid low inflation, the growth path is a touch more muted because of the soft consumption and nonfarm payrolls release. However, this is seen as more noise than signal.
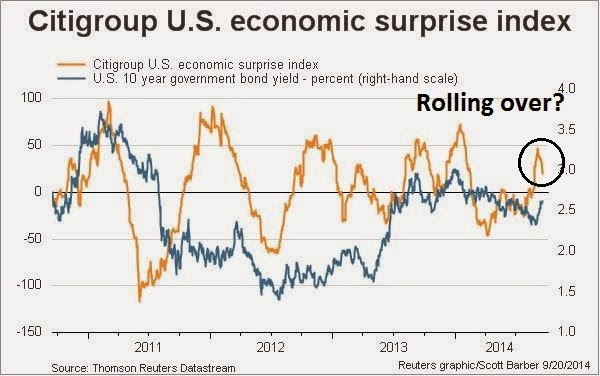
The Citigroup US Economic Surprise Index also appears to be starting to roll over after reaching a zone of excessively high expectations (see my recent comment A tactical sell signal, but no sign of a major top):
What's more, the Atlanta Fed's GDPNow, the "nowcast" of Q3 GDP, continued to fall. The latest reading on September 18 was 3.2%, down from 3.4% on September 12 and 3.6% on September 4.
Falling macro growth expectations will eventually translate to a loss of EPS momentum. While bottom-up estimates remain relatively upbeat right now, investors should be prepared for downgrades in the near future as growth headwinds intensify.
Another headwind for SPX EPS comes from a combination of slowing foreign growth, whose risks I detailed above, and the surging USD. Large cap S&P 500 companies derive roughly 40% of their sales from foreign sources and a rising greenback. If this remains unhedged, it would cut into earnings translated back into USD. Under that scenario, large cap and small cap EBIT margins could converge (from my previous post What keeps me awake at night):
While the characteristics of US large and small capitalization stocks are not directly comparable, this chart from UBS shows the differential in EBIT margins between the two. Should foreign growth start to slow, large and small cap EBIT margins will likely start to converge, with large cap margins falling toward their small cap counterparts for cyclical reasons.
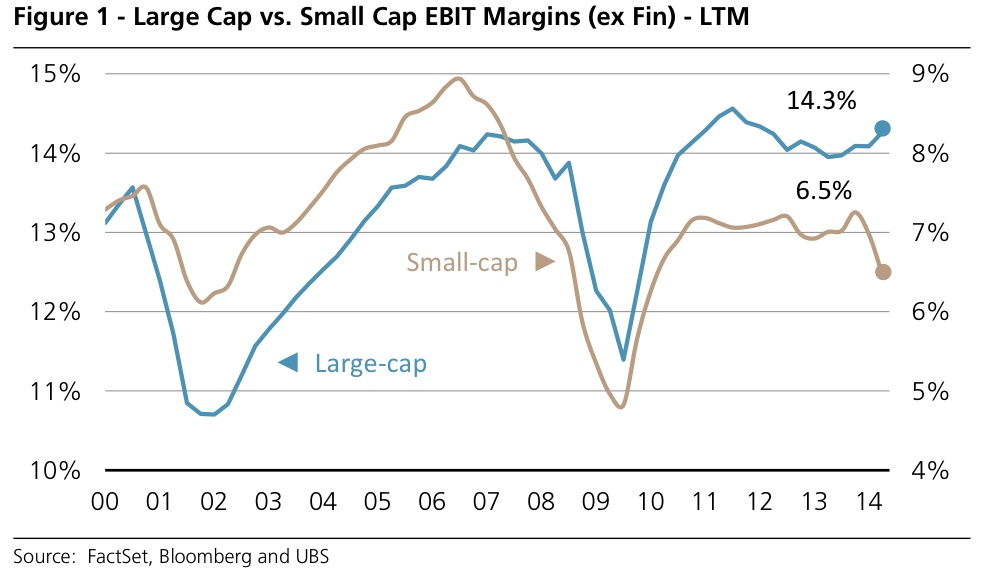
Should we start to see an operating margin squeeze because of a weakening economic cycle, large caps will likely see a double whammy of reduced risk appetite, which would then see PE ratios compress.
For another perspective, see this Marketwatch article showing the concerns of the effects of greenback strength on Consumer Discretionary stocks like Nike (NYSE:NKE).
Risk appetite is falling
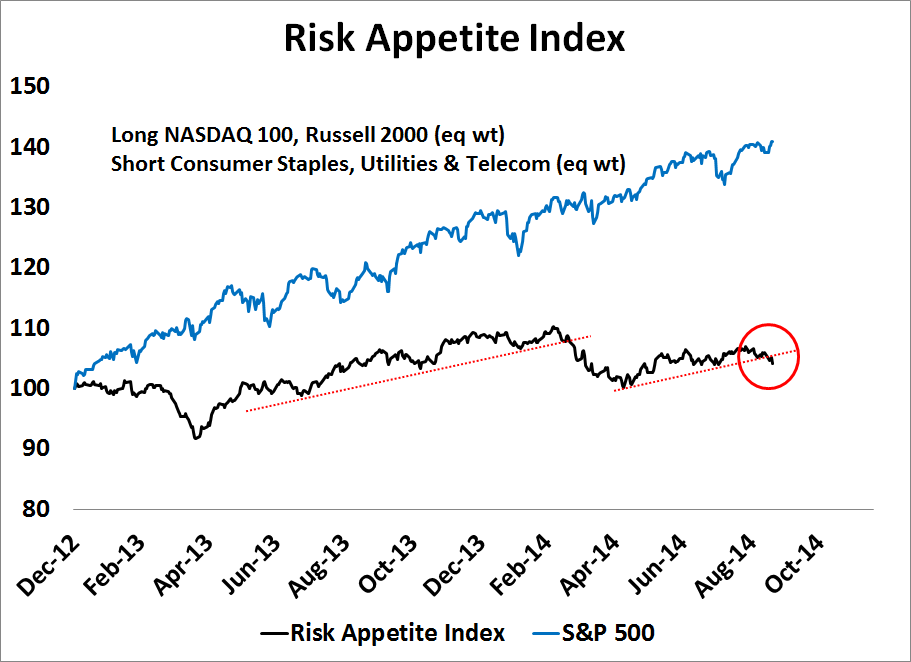
The combination of heightened valuation, crowded long positions in selected risky assets and falling growth expectations are negative for the stock market outlook. Indeed, my Risk Appetite Index, which consists of long positions in the high-beta NASDAQ 100 (via PowerShares QQQ ETF (NASDAQ:QQQ)), and the Russell 2000 (via iShares Russell 2000 Index (ARCA:IWM)) and short positions in Consumer Staples (via SPDR - Consumer Staples (ARCA:XLP)), Utilities (via SPDR Select Sector - Utilities (NYSE:XLU)) and Telecom (via iShares US Telecommunications (NYSE:IYZ)), is starting to falter.
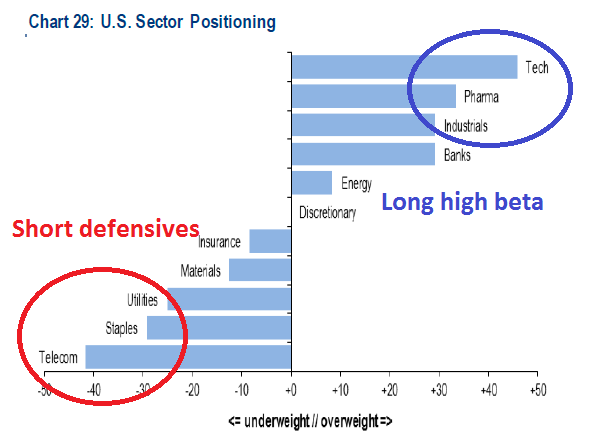
The BoAML Fund Manager Survey shows another point of US equity market vulnerability. Institutions are overweight high-beta sectors and underweight defensive low-beta sectors. Should the environment change from risk-on to risk-off, the adjustment could be violent and disorderly.
When I put it all together, the weight of the evidence suggests that equities are poised for a pullback of unknown duration and magnitude. However, bulls can be consoled by the fact that there is no recession in sight and therefore the risk of a major bear market is minimal.
Prepare for a pullback
Last week, I wrote that my Trend Model was turning tactically bearish (see A tactical sell signal, but no signs of a major top) but equities rallied on global news. However, it was an event laden week and traders had to be nimble.
On Tuesday, I tweeted that given the SPX was approaching a short-term oversold condition, it may be time to “call an audible“ and flatten short positions (follow me on Twitter at @humblestudent for real-time updates).
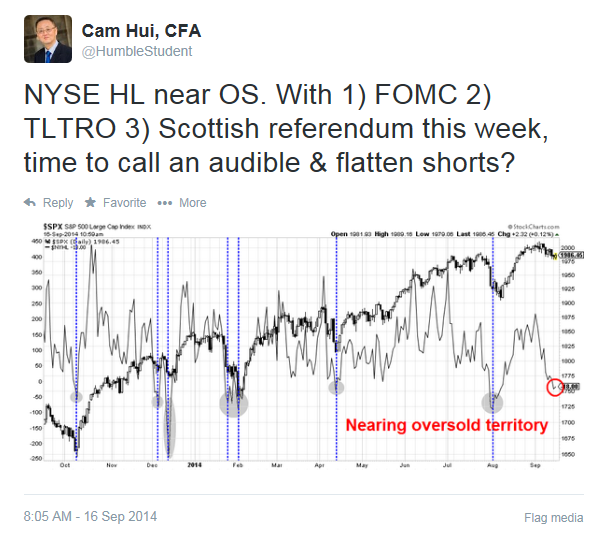
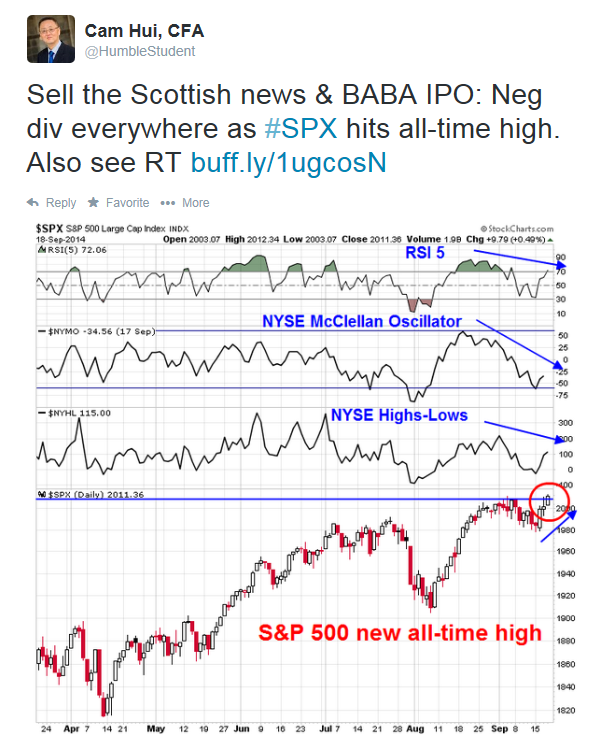
My inner trader is bearishly positioned and believes that the market is poised for a pullback of unknown proportions. If recent history is any guide, the pullback is likely to be a mild hiccup of about 5%. If equity market weakness materializes, my inner trader is watching how growth expectations evolve and how short-term sentiment indicators develop. How serious will the downgrades be? Will the markets panic as they did recently (see sentiment comments in A tradable bottom?), which would be contrarian bullish, or will complacency set in, which would be bearish?
My inner investor is not worried about minor market blips and he remains bullish as the long term US outlook remains positive (see Gene Epstein's column in Barron's for a good summary). He is, however, watching carefully how growth expectations evolve. If they were to decline significantly, it would be a sign to de-risk his portfolio.
Disclosure: Long SPXU, TZA
Cam Hui is a portfolio manager at Qwest Investment Fund Management Ltd. ("Qwest"). This article is prepared by Mr. Hui as an outside business activity. As such, Qwest does not review or approve materials presented herein. The opinions and any recommendations expressed in this blog are those of the author and do not reflect the opinions or recommendations of Qwest.
None of the information or opinions expressed in this blog constitutes a solicitation for the purchase or sale of any security or other instrument. Nothing in this article constitutes investment advice and any recommendations that may be contained herein have not been based upon a consideration of the investment objectives, financial situation or particular needs of any specific recipient. Any purchase or sale activity in any securities or other instrument should be based upon your own analysis and conclusions. Past performance is not indicative of future results. Either Qwest or Mr. Hui may hold or control long or short positions in the securities or instruments mentioned.
