Get 40% Off
👀 👁 🧿 All eyes on Biogen, up +4,56% after posting earnings. Our AI picked it in March 2024.
Which stocks will surge next?
Unlock AI-picked Stocks

Bulls Break Flag Pattern

Published 04/24/2014, 03:12 AM
Updated 07/09/2023, 06:31 AM

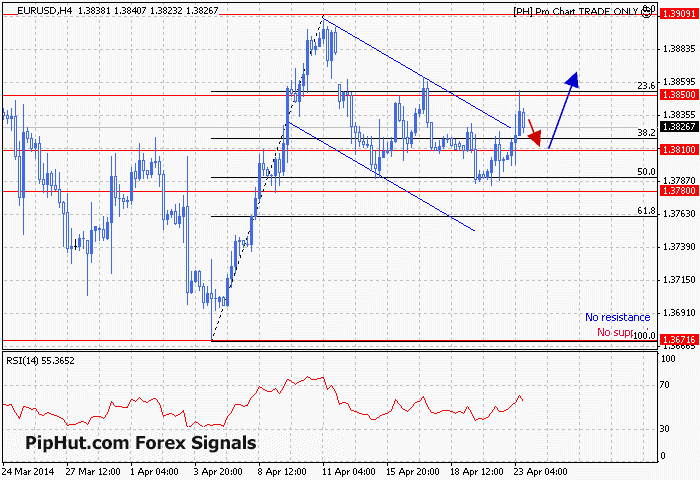
EUR/USD Daily Analysis: We saw a hard bounce off of 1.3780 support yesterday, sending the pair up over 70 pips to challenge 1.3850 a few hours ago. After that bounce (off of the 50% retracement of the 1.3670-1.3910 rally), which made a new high over the previous week’s daily candles, the hourly trend is short-term bullish. The rally also broke the topside of our bullish flag pattern (blue channel lines on 4h chart), adding bullish weight to the move.

EURUSD H4 Chart

4h Chart

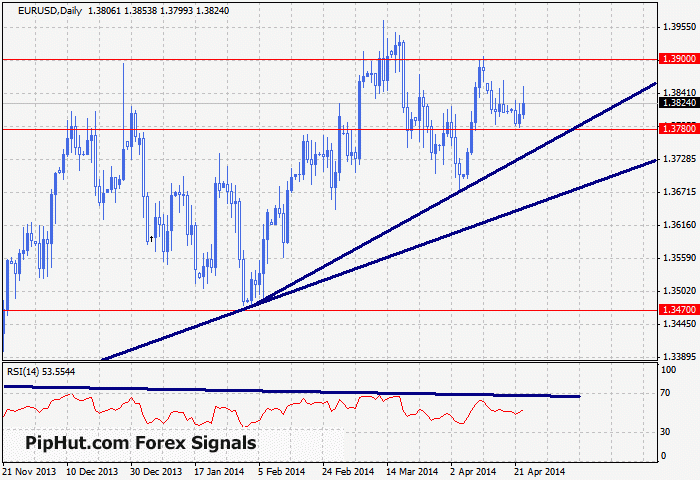
EURUSD daily Chart

Long-term Trend Analysis Chart

Our Preferred Trades*: We are looking to get long under 1.3830 with bullish confirmation, targeting a rally to 1.39/1.3950. A break beneath 1.3780 will signify that bears are once again in control in the short-term.

Yesterday’s EUR/USD SwingPRO Signal Result: Price rallied right through our narrow selling corridor of 1.3810-3830, never kicking out a strong enough bearish signal for us to sell.

Today’s SwingPRO Signal: We are looking for reasons to get long, starting with a resistance break under 3830 with a TP of 80 and a SL of 50.

*CandlePRO: CandlePRO can be used in conjunction with our daily analysis and “our preferred trades.” For example, if we prefer “going short” or “selling a rally” then we would look for bearish candlestick signals after a rally or near resistance levels. Alternative if we prefer “going long” or “buying a dip” then we would look for bullish candlestick signals on price drops or near support levels.

Today’s Important News Events:
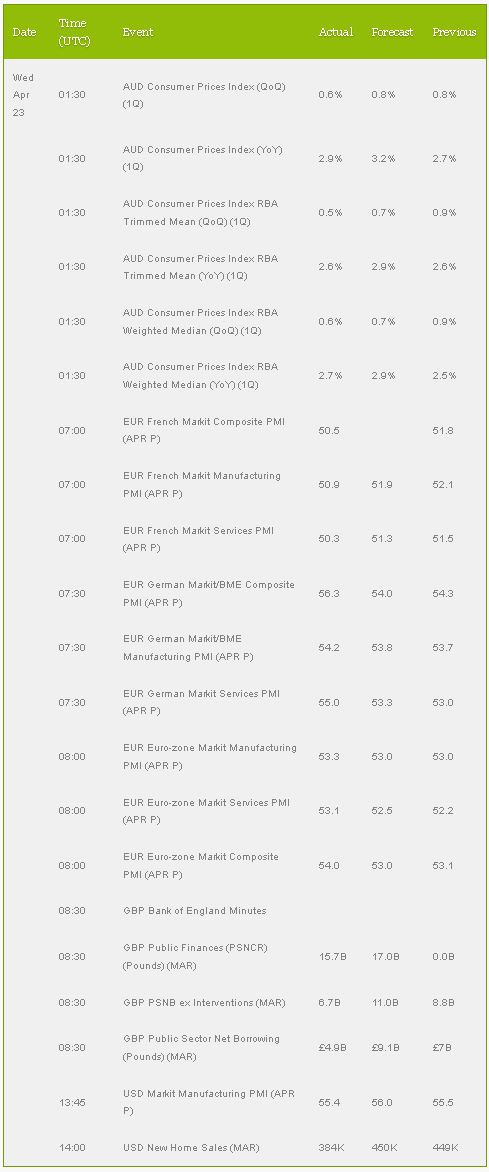
Forecast - Previous

3rd party Ad. Not an offer or recommendation by Investing.com. See disclosure here or remove ads .

Latest comments

Risk Disclosure: Trading in financial instruments and/or cryptocurrencies involves high risks including the risk of losing some, or all, of your investment amount, and may not be suitable for all investors. Prices of cryptocurrencies are extremely volatile and may be affected by external factors such as financial, regulatory or political events. Trading on margin increases the financial risks.
Before deciding to trade in financial instrument or cryptocurrencies you should be fully informed of the risks and costs associated with trading the financial markets, carefully consider your investment objectives, level of experience, and risk appetite, and seek professional advice where needed.
Fusion Media would like to remind you that the data contained in this website is not necessarily real-time nor accurate. The data and prices on the website are not necessarily provided by any market or exchange, but may be provided by market makers, and so prices may not be accurate and may differ from the actual price at any given market, meaning prices are indicative and not appropriate for trading purposes. Fusion Media and any provider of the data contained in this website will not accept liability for any loss or damage as a result of your trading, or your reliance on the information contained within this website.
It is prohibited to use, store, reproduce, display, modify, transmit or distribute the data contained in this website without the explicit prior written permission of Fusion Media and/or the data provider. All intellectual property rights are reserved by the providers and/or the exchange providing the data contained in this website.
Fusion Media may be compensated by the advertisers that appear on the website, based on your interaction with the advertisements or advertisers.
© 2007-2024 - Fusion Media Limited. All Rights Reserved.